Field manual for D2C operations leaders

The 90-Day
RTO Reduction Playbook

Go from diagnosis to a 25% cut in RTO in 90 days. Inside, you will find three sequenced phases, and how to measure progress.

RTO Hero Image
The 90-day target
−25%
relative RTO reduction across three phases
Baseline
32%
Day 90
24%
90 days
3 sequenced phases
7
RTO root-cause buckets
2.3 Cr
recovered / ₹100 Cr GMV
5–8×
Year-1 net ROI
Continue reading

Unlock the full report

Six findings, the full data, and the founder's letter. Get instant access.

51.1M
Shipments
63
Indian D2C brands
7
Categories analyzed
How to use this playbook

Not a read. A manual to execute.

This is not a blog post or a thought-leadership read. It is an operational manual, built to be printed, marked up, assigned, and executed.

The rules of engagement
Assign it. one team lead per phase, plus a 2-4person task force. Budget 6-8 hours of senior time a week.
Measure it. take a baseline RTO reading in Week 1. The 25% target only means something if you know your starting point.
Sizes the problem in ₹

Section 1 frames RTO in financial terms specific to D2C India. Read this with your CFO.

1-2-3
The 90-day execution plan

Each phase carries its diagnostic question, numbered steps with owner tags, the ClickPost module that executes it, the KPI to track, and its contribution to the 25% target.

The weekly review document

The KPI Scorecard is your Monday standup artifact, print it and bring it for 13 weeks. The Glossary is for mid-flight handoff.

Executive summary · The thesis

RTO is bleeding ₹6–9 crore a year, and most of it is invisible in your P&L.

In India, RTO runs 25–40% of shipped orders for D2C brands. On a ₹100 Cr GMV business at a 30% rate, the loaded cost (logistics both ways, blocked inventory, packaging, gateway fees) totals ₹6–9 crore a year, hidden across four cost centres.

Cutting it lifts margin per order 8-12% and frees working capital tied up in returns.  

Bottom line Cut RTO 25% in 90 days and free ₹1.5–2.3 Cr per ₹100 Cr of GMV.
The 90-day map at a glance
Three phases, each with its expected contribution to the 25% relative-reduction target.
01
Diagnose
Week 1–2

Audit the last 90 days. Attribute every RTO to one of seven root-cause buckets. Establish baseline KPIs. Identify your top three loss drivers.

- not direct, but every phase depends on it
02
Quick Wins
Week 3–6

COD order confirmation, post-checkout address verification, order editing, and automated NDR resolution.

40% of the target, roughly -3 to -4 points
03
Systemic
Week 7–12

AI Carrier Allocation per pincode, EDD accuracy, and WhatsApp/IVR pre-delivery windows.

~60% of the target, roughly -4 to -5 points
Not theoretical

D2C brands have already run this play.

Every intervention in this playbook is drawn from live ClickPost deployments. 

+9%
NDR to delivery conversions

Wellbeing Nutrition deployed AI voice agents to recover failed deliveries with automated engagement, feedback capture and action.

−3%
absolute RTO drop

Pilgrim brought its absolute RTO rate down three full points through carrier performance accuracy with AI carrier allocation.

−15%
support tickets

Miraggio reduced address verification escalations to their support team by implementing order editing on thank you page.

Rated on G2 for Logistics intelligence
High Performer Mid Market G2 2026 JAN 1 (1) Best Results Mid-Market - G2 g2-best-usability g2-easiest-setup g2-most-recommend
4.8 / 5 on G2, 4.4 on Capterra, across 450+ global brands

RTO is not one problem. It is seven upstream failures wearing the same jersey. Fix the attribution first, and the fixes pick themselves.

Naman Vijay
Naman Vijay
Co-founder & CEO, ClickPost
Section 1 - Why RTO is bleeding D2C India

The benchmark, the true cost, and why most efforts fail.

ClickPost proprietary data
RTO rate bands by category
Directional bands from ClickPost data. Yours vary by category, AOV and COD mix.
Category
Typical RTO band
Top quartile
New-Age Fashion (1)
Fashion & apparel (COD-heavy)
21% – 32%
< 21%
Skincare  (1)
Beauty & personal care
18% – 27%
< 18%
Wellness (1)
Health, wellness, nutraceuticals
18% – 29%
< 18%
Home & lifestyle
Home & lifestyle
16% – 25%
< 16%
ClickPost ClickPost FY2026 network data, COD orders, brands with 1,000+ COD shipments
1 · COD orders RTO at 7.1× prepaid
37.51%
COD
5.28%
Prepaid
COD is still 55 to 70% of orders despite UPI, and each one carries ~7× the RTO risk.
2 · Tier 3 RTO is 2.2× metro
Tier 3 pincodes23.73%
Metro cities10.92%
Yet this tier-2/3 long tail handles 47% of total volume.
The real cost of one RTO
350
approximately, on a Rs 1,200 order

RTO range: Rs 285- 490 depending on the order. The two costs teams forget are CAC you paid to acquire a customer who never converted, and stock blocked in transit.

Forward leg shipping ₹55–90
Reverse leg shipping ₹55–90
CAC amortization ₹60–95
Inventory blockage ₹40–60
Warehouse handling ₹25–40
Packaging (lost) ₹20–35
Quality re-inspection / loss ₹15–50
Gateway / COD reversal ₹15–30
ClickPost loaded-cost model, typical ₹1,200 AOV order
The number to remember
1 pp of RTO = ₹29.2 lakh

Every 1 percentage point of RTO reduction = 8,333 fewer RTO events annually = ₹29.2 lakh in recovered margin.

A 25% relative reduction from a 32% baseline (an 8 pp absolute drop) is worth roughly ₹2.3 crore annually on a ₹100 crore book, before counting LTV uplift.
GMV ₹100 CrAOV ₹1,200~8.33 lakh orders₹350 / RTO
Why most RTO efforts fail
01
Treating RTO as a single problem

Seven distinct upstream failures show up as one number. Without attribution, teams chase symptoms.

02
Optimizing in isolation

Checkout owns conversion, logistics owns cost, CX owns response time. RTO sits in the seam, owned by no one.

03
No baseline, no scorecard

Without a weekly scorecard by carrier, pincode tier, payment mode and category, gains are anecdotal and reversible. Phase 1 fixes this first.

01
Phase 1 · Week 1–2

Diagnose

Owner: Head of Operations + 1 data analyst Time: 12–16 hours total
How ClickPost helps: ClickPost normalizes every carrier's failure remark into 17 standardized NDR reasons and lets brands operate unique recovery journeys for each.
Specification5 steps
1.1Pull 90 days of shipment data
1.2Apply the 7-bucket RTO attribution framework
1.3Segment the data four ways
1.4Identify the top three loss drivers
1.5Build the baseline scorecard
The diagnostic question this phase answers

Where, specifically, are our RTOs coming from, by root cause, by carrier, by pincode tier, by payment mode, and by product category?

TL;DR

Two weeks: one dataset, seven buckets, four cuts, one baseline scorecard. By Week 2 you know, to the rupee, what your top three RTO drivers cost.

Step 1.1

Pull 90 days of shipment data

Data analyst, Day 1–2

Pull these fields for every shipment from the last 90 days. On ClickPost it's one export.

Order ID, AWB, dispatch date, delivery/RTO date
Origin & destination pincode + tier (metro/T1/T2/T3)
Carrier, service type (surface/air/express)
Payment mode (COD / prepaid)
Order value, product category, SKU count per order
NDR events (count, reason code, resolution outcome)
Final status (delivered / RTO / lost / damaged)
Customer pin-level repeat rate (first-time vs. repeat)
The field that matters most: NDR reason code against final status. Ensure you cross-tab it, and that holds 60% of your diagnosis.
Step 1.2

Apply the 7-bucket RTO attribution framework

Operations lead, Day 3–7

Every RTO maps to exactly one root cause, the one that first failed in the chain. A wrong address that cascaded into a COD refusal is a Bucket 2 (address) event, not Bucket 1.

7
root-cause buckets, ranked by share
Phase 2 fixPhase 3 fix
1
COD non-payment / refusal at door
COD orders, "customer refused" / "amount not ready" Phase 2
28–38%
2
Address quality failure
"address not found" / "incomplete" / "wrong pincode" Phase 2
18–26%
3
Customer unreachable / not available
multiple failed attempts, "consignee not available" Phase 3
14–20%
4
Fake or fraudulent orders
unverifiable phone, bulk from one device, mismatched signals caught at 2A verification
6–12%
5
Carrier service failure
RTO concentrated on specific carrier × pincode combos Phase 3
5–10%
6
Customer-initiated cancellation post-dispatch
cancel logged between dispatch and OFD, often slow EDD Phase 3
4–8%
7
Product / expectation mismatch
RTO concentrated on specific SKUs, size/color/desc gaps
3–7%
Sub-task 1.2a · Normalize reason codes

Map each carrier's NDR codes to standard buckets. Delhivery, Blue Dart, XpressBees, Ekart and Shadowfax all label things differently, so normalize before you classify.

Sub-task 1.2b · Sample-audit 100 RTOs

Check 100 RTOs against IVR recordings and customer comms. Expect to reclassify 15 to 25% on the first pass. That calibrates the whole dataset.

ClickPost analysis of 50M+ monthly shipments across 450+ brands
Step 1.3

Segment the data four ways

Data analyst, Day 7–10

Each cut surfaces a different lever.

Cut ARTO by payment mode

Split COD from prepaid. COD usually runs about 7× prepaid. Under 5×, look for fake prepaid orders. Over 10×, your COD verification is broken.

Cut BRTO by carrier × pincode tier

Score every carrier across metro, T1, T2 and T3. The gap between your best and worst carrier in T2/T3 is usually 20 to 25%, the biggest Phase 3 lever.

Cut CRTO by category & AOV band

RTO is lowest at mid-cart values and higher at both ends. Cheap orders customers don't bother refusing; pricey COD orders carry more risk.

Cut DRTO by customer cohort

First-time buyers RTO far more than loyal ones, dropping from ~29% on order one to ~22% by orders 6 to 10. The clearest reason to push first orders to prepaid.

Step 1.4

Identify the top three loss drivers

Rank the seven buckets by absolute ₹ loss over 90 days (₹350/event × count). For a typical ₹100 Cr GMV fashion brand:

1COD non-payment, first-time buyers in T2/T3₹40–60 L/qtr
2Address failures in 30–50 problem pincodes₹25–40 L/qtr
3Carrier underperformance on specific lanes₹20–35 L/qtr

Your numbers will differ. The exercise is the point.

Step 1.5

Build the baseline scorecard

A single page, refreshed weekly for 13 weeks. It contains:

Overall RTO rate (week / 4-wk trailing / 90-day baseline)
RTO by payment mode (COD vs. prepaid)
RTO by carrier (top 5 by volume)
RTO by pincode tier (metro / T1 / T2 / T3)
NDR-to-RTO conversion rate
First-attempt delivery (FAD) rate
Cost of RTO this week + cumulative since start
Top 3 loss drivers, with WoW change
Print it. Pin it. Review every Monday at 10 AM with ops leadership.
Products used in Phase 1
Live, in production, no build required
Book a free demo →
Module
What it does in this phase
Status
Unified Shipment Data Layer
Single-source export of all 90-day shipment data across carriers
● Live
NDR Dashboard
Unified view of all NDRs, across carriers
● Live

Not on ClickPost? Phase 1 takes 3 to 4 weeks instead of 2, mostly carrier reason-code normalization across Delhivery, Blue Dart, XpressBees, Ekart, and Shadowfax.

Phase 1 KPI checkpoint · End of Week 2
90-day shipment dataset extracted100% complete
7-bucket RTO attribution applied100% of RTO events classified
Four segmentation cuts producedAll 4 complete
Top 3 loss drivers identified & quantifiedRanked, in ₹
Baseline scorecard live & sharedPublished Week 2 Friday
100-order manual audit completedClassification accuracy > 85%
Common pitfalls in Phase 1
Skipping the manual audit

Teams trust carrier-reported NDR codes. Don't. The 100-order audit catches 15–25% misclassification that distorts every downstream decision.

Stopping at the overall number

A 28% overall RTO tells you nothing actionable. It can mean uniform failure or two carriers failing catastrophically in T2. The diagnosis is in the cuts, not the average.

Analysis paralysis

Two weeks is the budget. If data isn't perfect, classify with what you have and refine in Phase 2. Velocity matters more than precision at this stage.

02
Phase 2, Week 3–6

Quick Wins

Owner: Head of Ops + Checkout/Tech lead + CX lead Time: 24–30 hours across team
How AI helps here: Parth confirms COD orders before dispatch; automated NDR journeys recover failed attempts over WhatsApp and SMS.
Specification4 workstreams
2ACOD verification post checkout
2Bpost-checkout address correction
2CAutomated NDR resolution
2DOrder editing
The diagnostic question this phase answers

Which levers can be deployed in under four weeks with no carrier renegotiation, no warehouse changes, and no integrations beyond our existing stack?

TL;DR

Four workstreams, four weeks, all configuration-level. Combined: 8–10% points, about 40% of your 25% target.

Phase 2 expected contribution breakdown
2A COD verification
Bucket 1
~18%
2B Address verification
Bucket 2
~8%
2C NDR automation
Buckets 1, 2, 3
~9%
2D Order editing
Buckets 2, 6
~5%
Phase 2 total
~40%
How Phase 2 compresses the RTO funnel

Each gate kills a specific bucket before the parcel can fail delivery.

Order placed
100% volume
COD verification
via Parth Voice AI
Address validation
right after checkout
Order editing
fixes B2, B6
Dispatch
NDR resolution
B1 / B2 / B3 layer
Delivered
2A

COD verification at checkout

The thesis: COD drives the most RTO, about 7× prepaid. Don't kill it. Nudge customers to prepaid at checkout, and let Parth confirm the rest before dispatch.
Step 2A.1, Wk 3
COD-to-prepaid nudges

A checkout prompt offering ₹20 to 50 off to switch. Each COD order carries ~₹122 of expected RTO cost, so ₹30 to 50 to convert nets ₹100+.

Incentive tiers: ₹30 (<₹1,000), ₹50 (₹1,000–2,500), ₹75 (>₹2,500). Re-tune every 2 weeks.
By Wk 6: 18–28% of COD orders convert to prepaid, removing 6–10% of volume from the COD risk pool.
Step 2A.2, Wk 3
Parth confirms order intent

Before dispatch, Parth calls to confirm the order and offers a prepaid switch with a payment link on the same call.

Step 2A.3, Wk 4
Partial COD for high AOV

Above a set threshold, collect 20 to 30% online and the balance at delivery. Skin in the game slashes refusal-at-door.

Set the threshold at the AOV band where COD RTO crosses 40%. Expect a 4–7% checkout-completion dip, offset by a 60–70% drop in RTO on completed orders. Net economics strongly positive.

2A KPI checkpoint, End of Week 6
Baseline
Target
COD order share (% of total)
60–70%
50–58%
COD→prepaid conversion at checkout
0–5%
18–28%
COD orders confirmed by Parth pre-dispatch
0%
70–85%
COD RTO rate
32–40%
22–28%
2B

Post checkout address verification

The thesis: Bad addresses are almost entirely preventable at checkout. Validate structurally where the address is captured.
Address validation
Step 2B.1, Wk 3
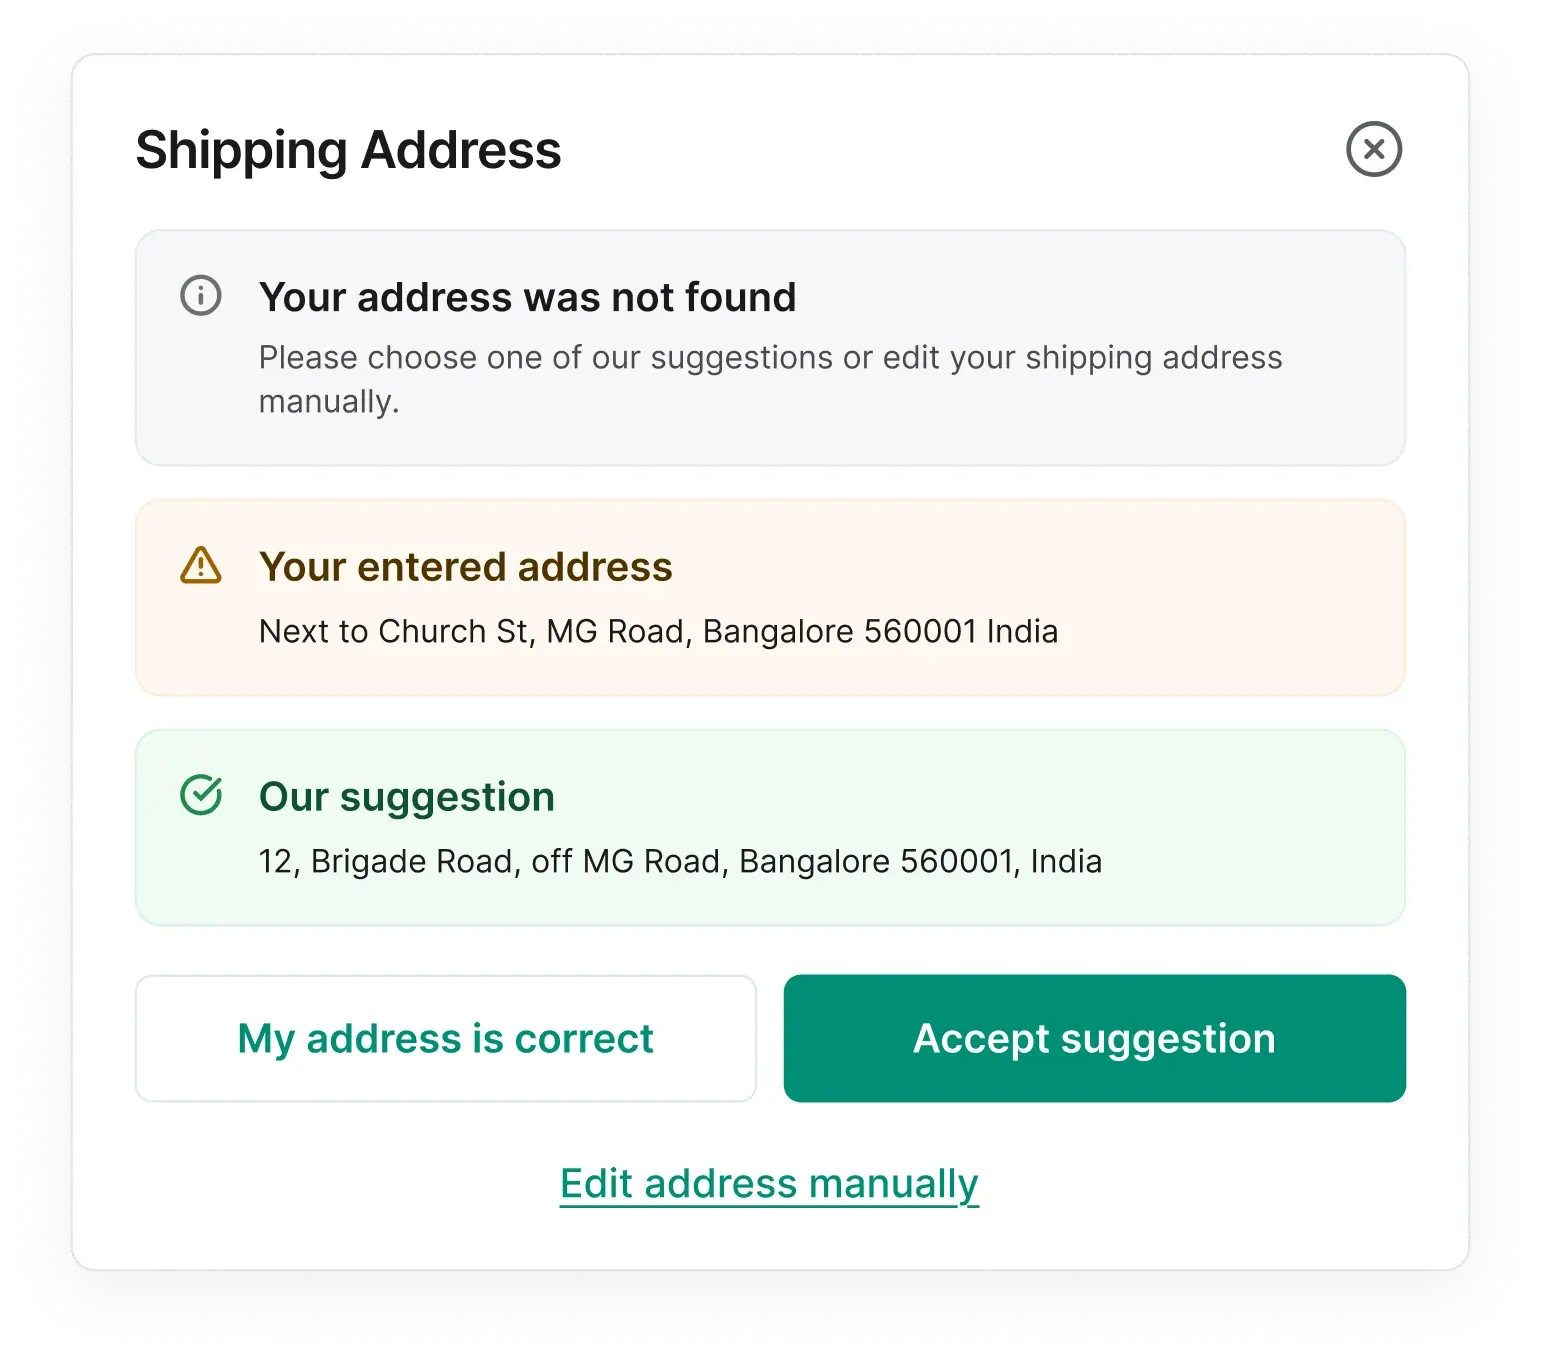
Parth AI confirms addresses

For orders flagged as risky, Parth calls to confirm the delivery address before dispatch and pushes corrections back to the OMS 

Step 2B.2, Wk 3
Pincode-level RTO risk scoring

Identify the top 30–50 pincodes by absolute RTO volume. Build a risk score from Phase 1:

Low <15% RTO
Medium 15–30%
High >30%, add friction: OTP, prepaid-only, extended EDD

Refresh scores monthly.

Step 2B.3, Wk 4
Landmark intelligence

For vague-but-valid addresses, add landmark auto-complete. Require a nearest-landmark field in T2/T3 and let repeat buyers one-tap their last good address.

Already in the system? Bad addresses on placed orders are fixed in the pre-dispatch window. Workstream 2D covers it.
2B KPI checkpoint, End of Week 6
Baseline
Target
Orders with validated, complete addresses
60–75%
> 95%
Bucket 2 (address failure) RTO share
18–26%
< 12%
High-RTO pincode-specific RTO rate
35–50%
25–35%
2C

Automated NDR resolution

The thesis: An NDR isn't an RTO yet, it's a 24 to 72 hour window to save the order. 97% of RTOs start as an NDR.

Network NDR-to-RTO conversion is 48% and climbs with every failed attempt. ClickPost's top quartile keeps it under 25%.

NDR→RTO conversion by attempt
20.2%
1st NDR
45.5%
2nd NDR
88.5%
3+ NDR
Step 2C.1, Wk 4
Real-time ingestion & triage

The first 2 to 4 hours after an NDR are the best chance to resolve it. Ingest in real time and route resolvable NDRs into automation within 30 minutes.

Step 2C.2, Wk 4
Automated outreach, two layers
Basic, self-serve messaging

WhatsApp, then SMS if unread, carries the NDR reason and one-tap actions: re-attempt, update address, or switch to prepaid. Resolves 35–45% within 2 hours.

Advanced: Parth, AI voice agent

For single call and scalable resolutions, Parth calls the customer, and pushes redelivery instructions to the courier over API.

Step 2C.3, Wk 5
Re-attempt & carrier instruction

On confirmation, push the re-attempt to the carrier within 15 minutes with the updated slot and address. Track success by carrier, it feeds Phase 3.

Parth, AI voice agent

When manually NDR calling doesn't scale, adopt Parth

Parth calls customers, giving a seamless experience and pushes the outcome straight to the courier over API.
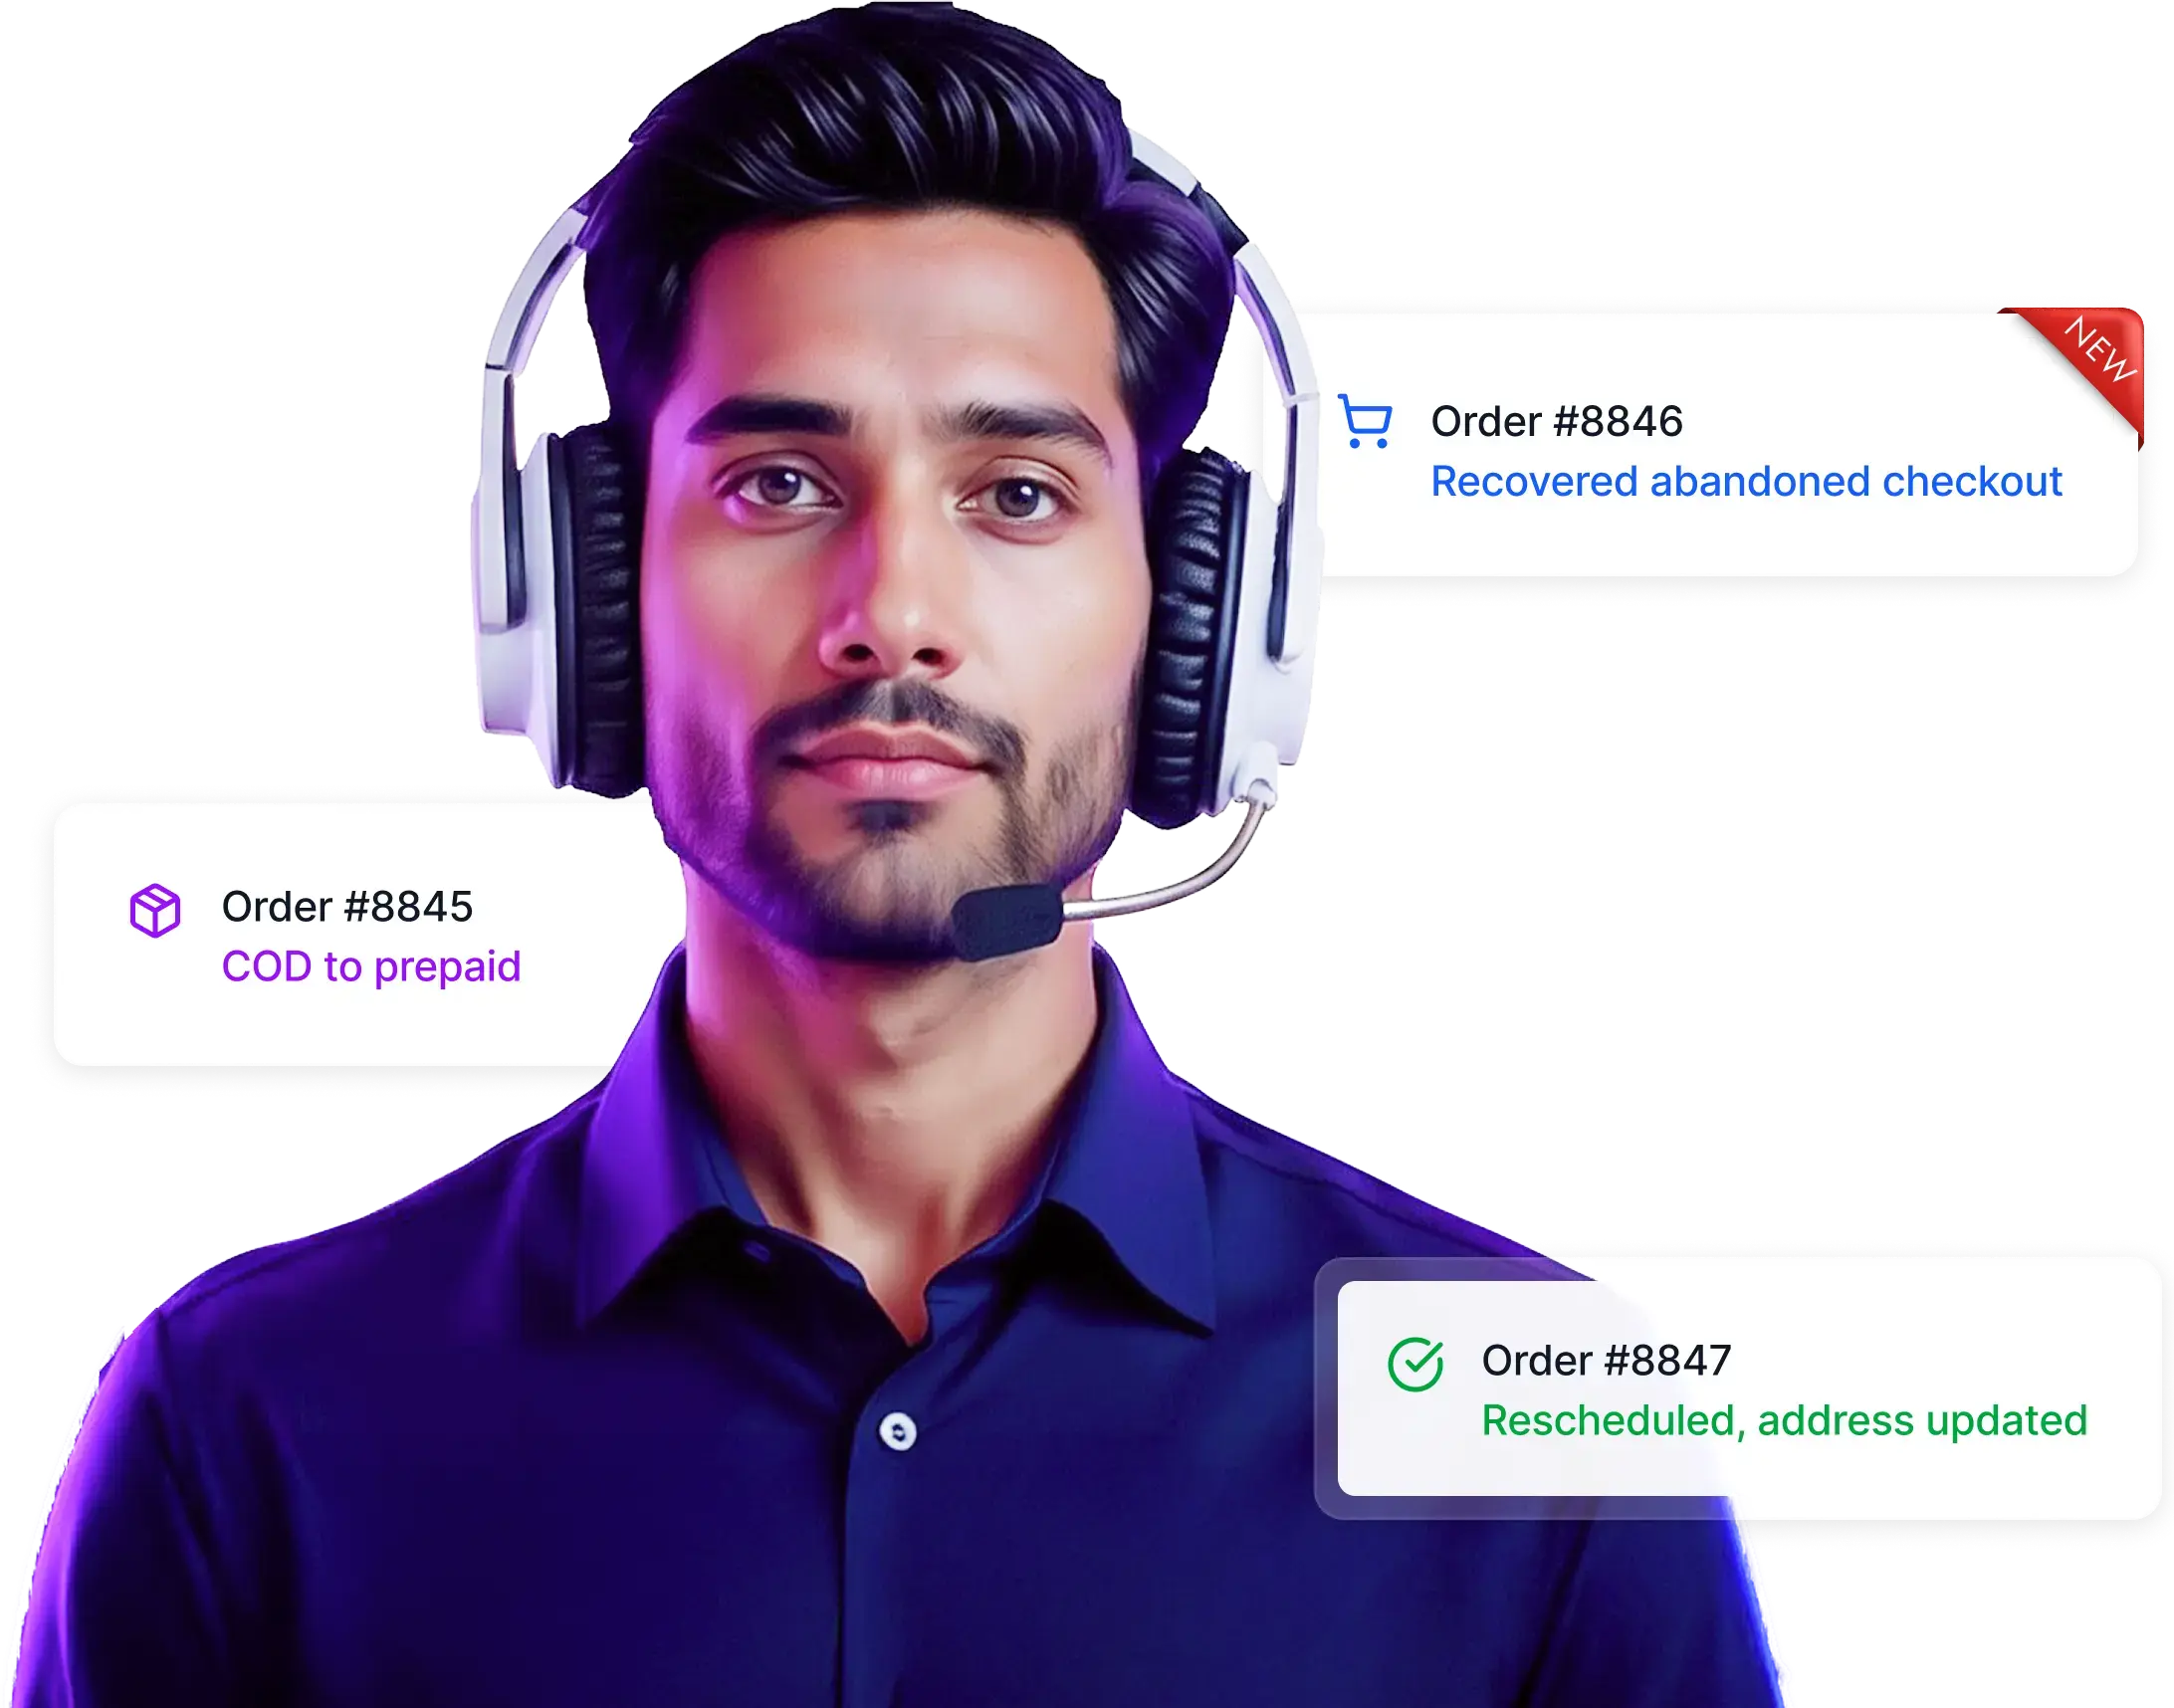
Switches COD orders to prepaid on the call
Recovers abandoned checkouts
Reschedules delivery & updates the address
Talk to Parth - Banner Image
2C KPI checkpoint, End of Week 6
Baseline
Target
NDR-to-RTO conversion rate
40–55%
< 28%
NDR resolution within 4 hours
10–20%
> 55%
WhatsApp NDR response rate
0–15%
> 35%
Re-attempt success rate
35–45%
> 60%
2D

Order editing & post-order address fix

The thesis: Many RTOs lock in the second a customer mistypes an address or changes their mind. Let them fix the order before dispatch: a correction, or a clean cancel that never ships.
Step 2D.1, Wk 5
Post-order address validation & edit

Right after checkout, ClickPost validates the address against Google Maps and serviceability. Customers fix address, phone or pincode from a self-serve link; your team can too.

Corrected details sync back to the OMS. The edit window locks the moment fulfillment begins, so nothing ships to a bad address.
Step 2D.2, Wk 5–6
Edit items & self-serve cancellation

Let customers swap a size or variant, change quantity, or cancel cleanly before dispatch:

A would-be "wrong item" refusal becomes a corrected order
A change-of-mind becomes a clean pre-dispatch cancel, not an RTO round-trip
Runs on the ClickPost Shopify order-editing app, no dev lift
2D KPI checkpoint, End of Week 6
Baseline
Target
Orders with post-order address validation
0%
100%
Address corrections captured pre-dispatch
N/A
3–6% of orders
Clean pre-dispatch cancels (vs. shipped RTO)
N/A
+40–50%
Products used in Phase 2
Live, in production, no build required
Book a free demo →
Module
What it does in this phase
Status
COD-to-Prepaid Conversion
Parth calls to confirm intent and switch COD to prepaid
● Live
NDR Automation Suite
NDR dashboard, NDR recovery journey builder with multi-channel outreach (WhatsApp/SMS/IVR)
● Live
Order Editing (Shopify app)
Self-serve edits to address, items, or cancellation before dispatch; post-order address validation
● Live
Parth, AI voice agent
Calls high-risk COD and failed-delivery customers to verify, reschedule, and push courier redelivery instructions via API
● Live
WhatsApp Business API Integration
Outbound NDR resolution, COD confirmation, delivery notifications
● Live
Phase 2 KPI checkpoint, End of Week 6

The consolidated scorecard to review before moving into Phase 3.

KPI
Phase 1 baseline
End Wk 6 target
Impact
Overall RTO rate
32%
24–26%
−6 to −8 pp
COD order share
60–70%
50–58%
Lever
NDR-to-RTO conversion
40–55%
< 28%
Lever
First-attempt delivery (FAD)
65–72%
75–80%
Outcome
Cost per RTO event
₹350 (loaded)
Unchanged
Volume savings
Common pitfalls in Phase 2
A flat discount for every COD order

₹50 off on every COD order is a margin leak. Reserve the incentive for the orders that need it, repeat buyers in metros rarely do.

NDR automation as notifications

"Your delivery failed" without an actionable next step is noise. The single-tap action (re-attempt / update / switch to prepaid) drives the 35–45% resolution rate.

Editing window that never locks

Let customers edit or cancel up to dispatch, then lock hard. If the window stays open after fulfillment starts, you get mid-pick changes and split shipments that create fresh RTOs.

Not refreshing pincode scores

A pincode high-risk three months ago may have a new carrier serving it well today. Monthly refresh is non-negotiable.

03
Phase 3, Week 7–12

Systemic

Owner: Head of Ops + Carrier Manager + Tech lead Time: 36–44 hours across team
How AI helps here: performance-based allocation scores every carrier lane daily and routes each order to the carrier least likely to fail on that route.
Specification3 levers
3AAI Carrier Allocation
3BEDD optimization
3CWhatsApp / IVR pre-delivery windows
The diagnostic question this phase answers

What structural changes to our carrier mix, delivery promise, customer communication, and pre-dispatch intelligence drive the rest of the 25% target, and sustain it past Day 90?

TL;DR

Phase 2 was config switches; Phase 3 is the operating model. Together it delivers about 60% of the target (roughly -4 to -5 points)

Phase 3 expected contribution breakdown
3A AI Carrier Allocation
Buckets 3, 5 (+1, 2)
~35%
3B EDD optimization
Bucket 6
~10%
3C WhatsApp/IVR comms
Bucket 3
~15%
Phase 3 total
~60% of the target
3A

AI Carrier Allocation

The single largest lever in the playbook

The thesis: Static carrier allocation is the biggest source of preventable RTO. Every pincode ranks carriers differently. Allocating dynamically per pincode is what separates a 28% operation from a 19% one.
Performance Based Allocation is like moving from riding a tricycle to a sports bike in some form. Comparable to having me behind the stumps keeping for you in gully cricket versus having MS Dhoni.
anirudhlikhite
Anirudh Likhite,
SVP Supply Chain and Procurement, Pilgrim
Step 3A.1, Wk 7
Build the carrier × pincode performance matrix

For every carrier and pincode pair, score RTO, FAD, TAT, NDR and damage over 90 days. Rank carriers per pincode by a weighted composite.

Default composite weights (D2C fashion)
RTO rate
40%
FAD rate
25%
Damage/loss
15%
TAT
12%
COD remittance
8%

Premium/high-AOV: raise damage weight. Fast-fashion/replenishment: raise TAT weight.

Step 3A.2, Wk 8
Define allocation rules, three modes, deployed in sequence
1Static rules, Wk 8

Hard-code the top-2 carriers per pincode for your top 100 pincodes, with a fallback. No ML, yet typically worth 3 to 5 pp in two weeks. Cap each carrier's share and pull volume back if lane RTO spikes.

2AI dynamic, Wk 9

Switch on the AI engine for all pincodes. It weighs live capacity, per-pincode performance, order and customer attributes, and cost, returning a per-order carrier pick in milliseconds at AWB generation.

3Learning, Wk 10+

Scores refresh daily. A carrier slipping on a lane is deprioritized within days; overperformers gain share automatically. This is the loop PlatinumRx, Pilgrim and Avimee ran.

How AI Carrier Allocation makes one routing decision
Order attributes AOV, payment, dims
Customer attributes cohort, history
Carrier capacity real-time
Pincode performance matrix
AI scoring engine
weighted composite, ms latency
Carrier selection
+ AWB generation
↻ Continuous learning loop, dispatch outcomes feed daily back into the performance matrix.
Step 3A.3, Wk 8–9
Carrier capacity negotiation

As volume shifts to your best carriers, renegotiate: capacity guarantees with the winners, performance-linked pricing across the board. Close it by Wk 10.

3A KPI, End of Wk 12
Base
Target
Shipments via performance scoring
0–15%
> 90%
Carrier × pincode valid-score coverage
N/A
> 80% vol
Top-2 carrier concentration (high-vol pins)
N/A
> 75%
RTO contribution from reallocation
Base
−7 to −9 pp
3B

EDD optimization

The thesis: Most post-dispatch cancels are EDD mismatch: you promised 3 to 5 days, it's tracking to Day 7. Show honest, pincode-specific EDD, and flag slippage early.
Step 3B.1, Wk 8
Pincode-specific EDD prediction

Replace blanket ranges with a predicted date per pincode and carrier, using live TAT and cutoffs. Show a specific date ("Delivery by Tue, 9 Dec"), not a range.

8–12% lower cart drop-off + 40–50% fewer Bucket 6 cancellations.
Step 3B.2, Wk 9
EDD slippage early-warning

When a shipment slips past its promised EDD by 24 hours, auto-send a WhatsApp with the revised date and a one-tap accept, reschedule or cancel.

Step 3B.3, Wk 10
Service tier upsell

For high-AOV or time-sensitive orders, offer a paid express tier at checkout. A customer paying ₹40 for next-day is 6 to 8× less likely to RTO.

3B KPI checkpoint, End of Week 12
Phase 2 base
Target
Checkout sessions showing specific EDD
20–40%
> 95%
EDD accuracy (% delivered by promised date)
65–75%
> 88%
Bucket 6 (post-dispatch cancellation) volume
Baseline
−50%
3C

WhatsApp/IVR pre-delivery communication windows

The thesis: "Customer unavailable" is preventable with one discipline: reach them in the 24 hours before delivery, not at the doorstep. It cuts this bucket from 14 to 20% down to 5 to 8%.
The pre-delivery communication waterfall
T-24h
WhatsApp confirmation

Confirm next-day availability. Four single-tap options: I'll be available, Reschedule, Alternate person, Prepaid pickup point.

55–65% open, 35–45% response
T-20h
IVR fallback

For non-responders. AI/IVR calls in the customer's own language (regional-language support is mandatory for T2/T3), checks availability, captures a preferred slot, and sends the revised instruction to the carrier over API.

OFD
OFD-day slot confirmation

Final delivery-window WhatsApp with the carrier's actual slot (where available) or a time band, plus the delivery executive's contact number where policy allows.

3C KPI checkpoint, End of Week 12
Phase 2 base
Target
Shipments with T-24 customer communication
0–15%
> 90%
WhatsApp T-24 response rate
N/A
> 35%
Bucket 3 (customer unreachable) RTO share
14–20%
5–8%
Products used in Phase 3
Live, in production, no build required
Book a free demo →
Module
What it does in this phase
Status
AI Carrier Allocation Engine
Per-order, per-pincode carrier recommendation with continuous performance learning
● Live
EDD on PDP and Tracking
Pincode-specific, carrier-specific, real-time delivery date prediction
● Live
Notification Suite
Pre-delivery confirmation, proactive milestone communication
● Live
Carrier Performance Analytics
Real-time carrier scorecards with weighted composite scoring
● Live
Phase 3 KPI checkpoint, Day 90

The achievement criteria for the 25% relative RTO-reduction target.

KPI
Phase 1 baseline
End Wk 12
Impact
Overall RTO rate
32%
23–25%
−7 to −9 pp
NDR-to-RTO conversion
40–55%
< 22%
Stabilized
FAD rate
65–72%
82–87%
+12–15 pp
EDD accuracy (% on time)
65–75%
> 88%
Trust
% via performance allocation
0–15%
> 90%
Steady state
Cost per delivered order
Baseline
−6 to −9%
Net savings
Common pitfalls in Phase 3
Set-and-forget allocation

The performance matrix needs weekly review for the first 8 weeks. New pincodes appear, networks shift, seasonal effects (monsoon, festive, regional events) change the rankings.

Renegotiating too early

Wait for 6 weeks of allocation outcome data (end of Wk 12) before re-cutting major contracts. Earlier, you're negotiating from incomplete information.

EDD set too tight

95% on-time on a tighter EDD beats 75% on a wider one. If your predictor misses > 12% of the time, widen it by half a day. Trust and accuracy compound.

Over-concentrating on one carrier

Shifting all volume to your single best carrier creates capacity risk and kills rate leverage. Cap each carrier's share per pincode and keep a live fallback.

Suppressing T-24 in festive spikes

The instinct under volume pressure is to cut non-critical messaging. Don't. Festive spikes are exactly when Bucket 3 balloons and pre-delivery confirmation has the highest marginal value.

Section 5, The 90-day KPI scorecard

The operating heartbeat of the program.

Print it. Pin it. Review it every Monday at 10 AM with operations leadership for 13 weeks.

Weekly cadence
One row per week, Week 1 through Week 13.
Color coding
on/ahead, within 10%, >10% behind. Flags trigger root-cause discussion.
Ownership
Each KPI has a named owner who walks the room through the number and the cause-action plan.
Source of truth
Pull every number from a single source. Don't let "our report says X, logistics says Y" burn the meeting.
The 13-week scorecard structure
Wk
Phase
Primary KPI focus
Owner
1
Diagnose
Dataset extraction, NDR taxonomy normalization
Data Analyst
2
Diagnose
7-bucket attribution, segmentation cuts, baseline scorecard live
Head of Ops
3
Quick Wins
COD-to-prepaid nudge deployed, address validation live
Tech Lead
4
Quick Wins
NDR automation deployed, WhatsApp T-24 outreach active
CX Lead
5
Quick Wins
Order editing & post-order address fix live, partial COD for high AOV
Tech Lead + Ops
6
Quick Wins
Phase 2 KPI checkpoint review
Head of Ops
7
Systemic
Carrier × pincode performance matrix built
Carrier Manager
8
Systemic
Static rules-based reallocation live, EDD predictor on checkout
Tech Lead
9
Systemic
AI Carrier Allocation full deployment, EDD slippage alerts
Carrier Manager
10
Systemic
WhatsApp T-24 + IVR fallback live, RTO prediction ML scoring active
Tech Lead + CX
11
Systemic
High-risk order intervention workflow live
Ops + CX
12
Systemic
Phase 3 KPI checkpoint, Day 90 review
Head of Ops
13
Steady-state
Program institutionalized, weekly review cadence locked
Head of Ops
The weekly KPI dashboard, one-page template
The one page ops leadership reviews every Monday.
RTO Reduction, Weekly Scorecard
Week ___ of 13, Reviewed Monday 10 AM
On/ahead Within 10% >10% behind
Metric
Wk 1 baseline
Wk N actual
Wk 13 target
Owner
Status
Overall RTO rate (%)
32.0%
 
24.0%
Head of Ops
COD RTO rate (%)
38.0%
 
24.0%
Head of Ops
Prepaid RTO rate (%)
9.0%
 
7.0%
Head of Ops
COD share of orders (%)
65.0%
 
53.0%
Checkout Lead
NDR rate (%)
18.0%
 
14.0%
CX Lead
NDR-to-RTO conversion (%)
48.0%
 
22.0%
CX Lead
First-attempt delivery (%)
68.0%
 
84.0%
Carrier Mgr
Address validation pass (%)
70.0%
 
95.0%
Tech Lead
% via performance allocation
0%
 
90%
Carrier Mgr
EDD accuracy (% on time)
70.0%
 
88.0%
Carrier Mgr
Cost per delivered order (₹)
Baseline
 
−7%
Head of Ops
RTO cost this week (₹ lakh)
 
−25% vs Wk 1
Head of Ops
RTO cost cumulative (₹ lakh)
 
Head of Ops
The ClickPost weekly RTO scorecard, print-ready template
The four questions the scorecard must answer in 10 minutes
A Monday review should not exceed 30 minutes. Answer four questions, then end.
01
Where are we vs. target?

Overall RTO, NDR→RTO, cost per delivered order. Three numbers, 90 seconds.

02
What slipped to amber/red?

Each owner of a flagged KPI takes 2 minutes: the cause and the action.

03
Highest-leverage action?

One thing. Not a list. One thing the team executes before next Monday.

04
Needs leadership?

Carrier escalations, tech bugs, vendor delays, surface here, route immediately.

Section 6, What "good" looks like at Day 90

Not just better numbers, a different operating model.

Executed with discipline, Day 90 leaves your ops function structurally different.

On the numbers
−25%+Overall RTO from a 30–35% baseline to 23–26%
<25%NDR-to-RTO conversion, vs 45–55% most brands live with
+12–15percentage points of first-attempt delivery
−6–9%Cost per delivered order
50–58%COD share, down from 60–70%, prepaid recovered at checkout, OTP, and NDR
On the operating model
Every high-doubt COD order is confirmed by Parth before dispatch. Nothing ships blind.
Every shipment allocated by performance, not static contract, re-tuned weekly.
Every customer gets a T-24 WhatsApp confirmation with single-tap options.
Every NDR ingested in real time, classified, and routed within 30 minutes.
Every checkout shows a specific, pincode-accurate EDD. No more "3–5 days."
On the team
One named owner per phase. One Monday review. One source of truth.
The RTO scorecard is a weekly operating document, not a quarterly board slide.
Ops, CX, checkout/tech, and carrier management share the 7-bucket vocabulary and one scoreboard.
Beyond the weekly view: ClickPost Apex tracks live forward, reverse, and RTO shipments, surfaces at-risk ones early, and feeds attempt/pincode patterns back into the risk scores. Smart Alerts route exceptions to the right team.
The financial outcome, ₹100 Cr GMV, ₹1,200 AOV
32% baseline
₹9.3 Cr
~2.67 lakh RTO events
24% post-program
₹7.0 Cr
~2.0 lakh RTO events

Execution cost, licensing, team time and prepaid incentives, is typically 12 to 20% of recovered margin.

ClickPost loaded-cost model, ₹100 Cr GMV illustration
Annual recovery
2.3 Cr
recovered margin per ₹100 Cr GMV
8–12%
margin/order lift
5–8×
Year-1 net ROI
Scaling beyond Day 90
Next 90 days (Days 91–180)
Expand AI allocation to long-tail pincodes below the first-round volume threshold
Extend performance-based allocation with longer carrier history, expect 1–2 pp more as it matures
Build a customer-level RTO risk score that travels across orders
Migrate carrier contracts to fully performance-linked pricing on validated data
Next 12 months (Year 1)
Move from RTO reduction to RTO prevention by design, bake signals into product-page UX, category strategy, and lifecycle management
Build the muscle to hold a sub-22% steady state, even under festive spikes
What this playbook does not solve

It won't fix product-market fit, pricing or bad targeting. If the wrong customers are buying the wrong products, no ops program fixes that.

Cut C is your early warning: if one category is high-RTO across every carrier and pincode, the fix is merchandising, not another NDR rule.

Accelerate with ClickPost

The interventions are executable. The infrastructure is the hard part.

This needs no new science, just the infrastructure to run it at scale across thousands of shipments, dozens of carriers, and millions of customer interactions per quarter. That is what ClickPost runs.

Why 450+ brands trust ClickPost for post-purchase logistics
450+
D2C, marketplace & retail brands
50M+
shipments processed every month
Every
major Indian carrier, integrated

Every module in this playbook, AI Carrier Allocation, NDR Automation, COD-to-Prepaid, EDD Predictor, Address Validation, Order Editing and Parth, is live in production today.

PlatinumRx Pilgrim Avimee Herbal + hundreds more
What a ClickPost deployment looks like for this playbook
Week 1–2, Onboarding

Carrier API connections, historical data ingestion, dashboard provisioning. Your Phase 1 audit runs on real data by Day 10.

Week 3–6

Phase 2 modules deployed and tuned. Your team operates them; ClickPost's CS engineering supports configuration.

Week 7–12

Phase 3 modules deployed. AI Carrier Allocation learns on your volume; RTO prediction ML calibrates to your base.

Day 90 onwards

Steady-state operations, weekly business reviews, quarterly carrier strategy sessions.

Accelerate with ClickPost
Map this playbook to your RTO baseline.

A 30-minute strategy session with our post-purchase team. We'll review your current numbers, identify the highest-leverage levers, and map a 90-day path forward.

Appendix, Glossary

For handoff.

If a team member is joining the program mid-flight, hand them this page first.

AWB, Air Waybill

The unique tracking number assigned to a shipment by the carrier. The primary key linking your order data to carrier data.

COD, Cash on Delivery

Customer pays at delivery. 55–70% of D2C orders in India and the driver of the majority of RTO volume.

COD-to-Prepaid Conversion

Incentivizing or routing customers from COD to prepaid at checkout or post-order, via nudges, OTP verification, or risk-based intervention.

EDD, Estimated Delivery Date

The promised or predicted date an order will be delivered. Accuracy directly drives customer-initiated cancellation rates.

ePOD, Electronic Proof of Delivery

Digital delivery confirmation, signature, photo, OTP, or geo-stamp. Critical for fraud prevention and dispute resolution.

FAD, First Attempt Delivery

The share of shipments delivered on the carrier's first attempt. A direct inverse correlate of RTO risk.

GMV, Gross Merchandise Value

Total value of orders placed, before returns, cancellations, or discounts.

NDR, Non-Delivery Report

A carrier event indicating a failed delivery attempt. Not yet an RTO, a resolution window. NDR-to-RTO conversion is one of the most important KPIs in the playbook.

OFD, Out for Delivery

Status indicating the shipment has left the last-mile hub and is with the delivery executive for that day's attempt.

Pincode Tier

Classification of Indian pincodes into metro / tier-1 / tier-2 / tier-3 by urban density, infrastructure, and carrier coverage maturity. Performance varies significantly by tier.

Prepaid

Customer pays online at checkout. Prepaid orders RTO at 3–5× lower rates than COD orders.

RTO, Return to Origin

A shipment returned to the seller's warehouse without being successfully delivered. The central metric of this playbook.

Order Editing

Lets customers correct address or contact details, swap items, or cancel an order before dispatch, so a fixable mistake never becomes an RTO.

TAT, Turn-Around Time

Elapsed time between two operational events, most commonly dispatch-to-delivery, NDR-to-resolution, and pickup TAT.

WISMO, Where Is My Order

Customer inquiries about order status, driven by delivery anxiety. High WISMO volume is a leading indicator of EDD problems and NDR gaps.

7-Bucket RTO Attribution

The Phase 1 framework mapping every RTO to the root cause that failed first in the chain. See Step 1.2 for the seven buckets.

ClickPost powers the post-purchase logistics stack for 450+ D2C, marketplace, and retail brands, processing 50M+ shipments every month across every major Indian carrier.

90-Day RTO Reduction Playbook, FY2026