.png?width=193&height=27&name=ClickPost%20Logo%20(Blue).png)
.svg)
.svg)
.svg)
.svg)
.webp?width=286&height=206&name=ROI%20Calculator%20(2).webp)
.svg)
.svg)
.svg)
.svg)
.svg)
.svg)
.svg)
.svg)
.svg)
.webp?width=286&height=206&name=Frame%201171276203%20(11).webp)
.svg)
.svg)
.svg)
.svg)
.webp?width=286&height=206&name=ROI%20Calculator%20(3).webp)
.svg)

.svg)
.svg)
.svg)
.webp?width=286&height=206&name=ROI%20Calculator%20(4).webp)
Cut support tickets and
failed deliveries in four steps
ClickPost works the whole delivery leg — from the branded tracking page to failed-delivery recovery — so fewer orders stall and fewer shoppers write in.
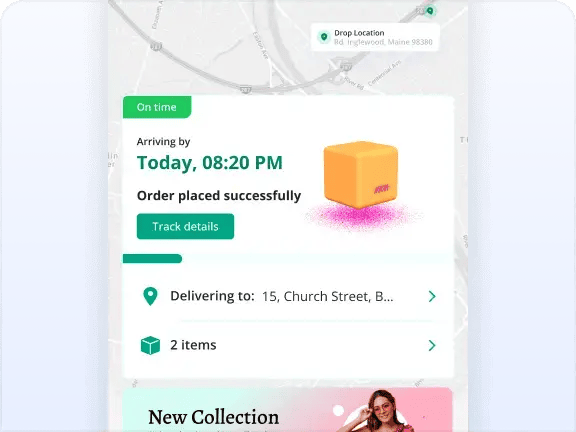
Give every order a branded page
One link carries your brand and live status. Shoppers stop writing in to ask where their parcel is.
.webp?width=576&height=432&name=div.cp-roi__hvis%20(1).webp)
Update them before they worry
A nudge on SMS, WhatsApp or email at each milestone answers the question before it gets asked.
.webp?width=576&height=432&name=div.cp-roi__hvis%20(2).webp)
Catch exceptions early
Delivery-exception alerts flag a failed attempt or a bad address while the shipment can still be saved.
.webp?width=576&height=432&name=div.cp-roi__hvis%20(3).webp)
Sell from the tracking page
That page pulls repeat visits. Put recommendations on it and route shoppers back to the store.
Eight factors that determine
post-purchase experience cost
you where a fix pays off first.
.svg)
WISMO ticket volume
Each "where is my order" ticket carries a loaded agent cost. Most of them never needed to exist.
.svg)
Delivery exceptions
A missed attempt sets off re-attempts, calls and, often, a return. The cost stacks quietly.
.svg)
Orders sent back before delivery
An order that bounces before it is delivered pays both shipping legs and earns nothing back. It is often the biggest hidden line.
.svg)
Carrier performance gaps
A weak carrier on a lane shows up twice: first as tickets, then as returns.
.svg)
Delivery-date accuracy
A vague or broken promise breeds anxiety, and anxiety breeds tickets and cancellations.
.svg)
Notification coverage
Anyone you cannot reach is someone who opens a ticket instead. Contactability caps the whole model.
.svg)
Tracking-page engagement
A plain carrier page throws away the repeat-visit traffic a branded one would earn from.
.svg)
Repeat-purchase capture
Traffic that lands on tracking and leaves without a nudge is revenue you simply skipped.










4.8 ★
out of 5 stars on G2.com
4.8 ★
out of 5 stars on G2.com
5B+
shipments automated per year
Post-purchase that plugs into
your existing stack
- 600+ Carrier Partners
- 75+ Communication Gateways
- 50+ Storefronts, OMS, WMS
-
 Shopify
-
 Magento
-
 Klaviyo
-
 Attentive
-
 Shipbob
-
 Shiphero
-
 UPS
UPS
-
 USPS
USPS