.png?width=193&height=27&name=ClickPost%20Logo%20(Blue).png)
.svg)
.svg)
.svg)
.svg)
.webp?width=286&height=206&name=ROI%20Calculator%20(2).webp)
.svg)
.svg)
.svg)
.svg)
.svg)
.svg)
.svg)
.svg)
.svg)
.webp?width=286&height=206&name=Frame%201171276203%20(11).webp)
.svg)
.svg)
.svg)
.svg)
.webp?width=286&height=206&name=ROI%20Calculator%20(3).webp)
.svg)

.svg)
.svg)
.svg)
.webp?width=286&height=206&name=ROI%20Calculator%20(4).webp)
10 E-commerce Conversion Rate Optimization Strategies


Ready to delight customers after checkout?
Trusted by 600+ brands
In this blog
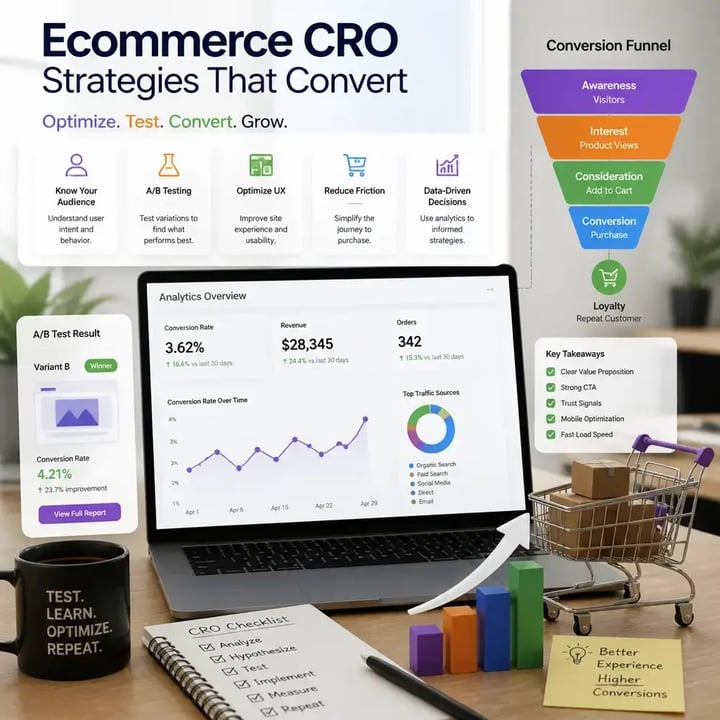
TL;DR – Top Ecommerce CRO Strategies That Lift Revenue in 2026
Ecommerce conversion is under pressure as ad costs rise and sitewide rates fall, creating a costly gap between traffic and revenue. Fixing purchase intent at key journey stages delivers more growth than incremental spend or surface-level design tweaks.
-
Segment Before Optimizing – blended rates hide broken segments worth fixing
-
Fix Friction First – known issues outrank untested A/B experiments
-
Benchmark Against Yourself – own historical data beats industry averages
-
Four-View Prioritization – source, device, cohort, journey reveal real gaps
-
Product Page Rebuilds – 62% of mobile PDPs have mediocre UX today
-
Guard Margin, Not Just Orders – refunds and returns can erase conversion gains
You open Monday’s dashboard expecting the extra traffic to show up in revenue. Instead, traffic is up 18%, paid spend has climbed with it, and sales have barely moved. Growth is asking for more budget, merchandising wants new landing pages, and your agency is ready with another round of button and headline tests. But you already know the issue is not reach. Too many qualified shoppers are arriving, considering the product, and leaving without buying.
That is the moment conversion rate optimization becomes useful, but only if you resist the urge to treat CRO as a collection of quick fixes.
Ecommerce CRO is the disciplined process of finding where purchase intent breaks, understanding why it breaks, and improving that part of the journey without damaging margin, order quality, or customer trust.
A change that raises orders but also increases refunds, discount dependence, or support contacts has not necessarily improved the business.
The pressure has grown as traffic has become harder to convert. Contentsquare’s 2025 Digital Experience Benchmarks found that digital ad spend rose 13.2% while conversion rates fell 6.1% across the experiences it analyzed. That gap is why this guide focuses on ten ecommerce CRO strategies you can prioritize, measure, and defend in a revenue meeting.
Why Ecommerce CRO Programs Stall
They optimize the blended average
A single sitewide conversion rate tells you whether the business moved, but it rarely tells you what to fix. Email subscribers, first-time paid-social visitors, returning customers, mobile shoppers, and high-AOV buyers arrive with different levels of intent. Blend them together and a healthy segment can hide a broken one, while a weak traffic source can make a strong page look ineffective.
Before you build a CRO backlog, break conversion down by device, source, new versus returning visitor, landing-page type, product category, and customer cohort. Then add contribution margin, cancellation rate, and return rate to the same view. You are not trying to find the lowest number. You are trying to find a meaningful gap where the visitor has enough intent to buy and the experience is getting in the way.
They start testing before fixing obvious friction
Experimentation sounds more rigorous than implementation, so teams sometimes A/B test problems that established usability research has already explained.
You do not need a six-week experiment to learn that hidden shipping costs, forced account creation, broken mobile fields, or an unclear returns policy creates friction.
Resolve the known friction before experimenting. Save controlled tests for choices where two credible approaches could produce different business outcomes.
What Is a Good Ecommerce Conversion Rate in 2026?
A good conversion rate is not a universal percentage. It is a profitable improvement against a comparable baseline. A 1% rate can be healthy for a considered, high-AOV purchase that takes several sessions, while 4% may be weak for a replenishment product sold to returning subscribers. The useful comparison keeps the product, intent, device, and acquisition source as consistent as possible.
Build your benchmark from your own last six to twelve months, then compare the same cohort over time. If your store receives 50,000 monthly visits at a $75 AOV, moving from 2% to 3% conversion adds 500 orders and $37,500 in monthly gross revenue before returns, discounts, and fulfillment costs. That calculation gives the opportunity a dollar value, but your P&L still decides whether the lift was worthwhile.
Use four views before you prioritize
| View | Question to answer | Guardrail metric |
| Acquisition source | Which channels bring visitors who are ready to evaluate or buy? | Contribution margin after media spend |
| Device | Where does the same intent convert differently on mobile and desktop? | Page speed, errors, and abandonment by step |
| Customer cohort | How do new, returning, VIP, and high-return shoppers behave? | Repeat purchase, cancellations, and return rate |
| Journey stage | Which page or action loses the most qualified shoppers? | Progression to the next meaningful step |
The Top 10 Ecommerce CRO Strategies, Ranked by Practical Impact
1. Rebuild Product Pages Around the Buying Decision
Your product page has one job: help the shopper decide whether this product is right for them. Baymard’s 2026 Product Page UX benchmark found that 62% of mobile ecommerce sites had “mediocre or worse” product-page UX. That finding matters because nearly every buyer passes through a product page, and small information gaps often become direct exits.
Start with the objections that appear in reviews, support tickets, search terms, and return reasons. Then make the page answer them in the order they arise. Show the product in use, explain the outcome before the feature list, keep size and fit guidance close to the selector, display delivery and return information before the shopper reaches checkout, and place credible reviews near the decision they support.
A beauty product may need ingredients and application guidance; a mattress buyer may need dimensions, trial terms, and comparison help.
Measure add-to-cart rate alongside variant errors and return reasons. Hiding product limitations may lift conversion briefly while creating a more expensive returns problem.
2. Remove Checkout Friction Before Adding Incentives
Baymard’s cart and checkout research places the documented average cart abandonment rate at about 70%. Its 2026 data also shows that 18% of shoppers abandoned because a site required account creation and 17% left because checkout felt too long or complicated. These are not persuasion problems. They are design and process problems.
Make guest checkout the clearest path, show the full cost before the payment step, remove optional fields from the default flow, preserve entered information after validation errors, and offer the payment methods your customers actually use.
Baymard notes that an effective checkout can use 12 to 14 visible form elements, while the average US checkout in its benchmark presents far more. The exact number matters less than the discipline: every field should earn its place.
Track checkout completion by step and error type. A shorter form will not solve unexpected shipping costs or a failing payment method.
3. Design the Mobile Journey as the Primary Journey
Adobe Analytics reported that smartphones generated 56.4% of US online holiday spending in 2025. Mobile has moved beyond a discovery channel, yet many stores still treat it as a compressed version of desktop. That usually leaves key actions below the fold, selectors difficult to use, and overlays competing with the checkout itself.
Review the journey with one hand and a slow connection. Keep the main CTA reachable, use large tap targets, simplify variant selection, allow autofill, support mobile wallets, and remove pop-ups from high-intent steps. Product imagery should remain useful without forcing the shopper to pinch, zoom, and repeatedly close interface elements.
4. Treat Site Speed as a Revenue Constraint
Speed work often gets pushed into a technical backlog because no single visual change appears dramatic. The commercial effect is easier to see in the Google and Deloitte “Milliseconds Make Millions” study. Across 37 brand sites and more than 30 million sessions, a 0.1-second improvement across measured mobile speed metrics increased retail conversion rates by 8.4% and average spend by 9.2%.
Use field data, not only a clean lab test. Google’s current Core Web Vitals thresholds define a good experience as LCP within 2.5 seconds, INP at 200 milliseconds or less, and CLS at 0.1 or less at the 75th percentile. Compress and correctly size images, remove unused scripts, delay nonessential third-party tags, and test the pages that carry the most revenue before optimizing the whole site equally.
5. Place Social Proof Where Doubt Appears
Reviews, ratings, user-generated content, expert validation, and trust badges do different jobs. A star rating near the product title can reduce initial uncertainty, while a detailed review about fit belongs closer to the size decision. A payment-security message has more value near payment than in a logo strip at the bottom of the homepage.
Use support conversations and review themes to identify the doubt you need to resolve. Then match the proof to that doubt. Show image reviews when appearance matters, summarize recurring fit feedback, surface verified-purchase status, and make negative reviews easy to inspect. Hiding criticism may improve the average rating while reducing credibility.
Measure what shoppers do after using the proof. Reviews may expose a product problem rather than a placement problem.
6. Improve Search and Product Discovery
Shoppers who search or filter have declared what they want, which makes failed discovery especially costly. In Baymard’s Product Lists and Filtering research, sites with mediocre product-list usability saw far higher abandonment in usability testing than sites with a better toolset. The research also found that 36% of benchmarked sites had flaws severe enough to harm product finding.
Start with the queries that return no results, low click-through, or immediate exits. Support common misspellings and synonyms, show useful autocomplete suggestions, keep filters relevant to the category, preserve filter state, and merchandise broad queries instead of returning an unstructured wall of products. Search analytics can also expose demand that your navigation or assortment does not currently serve.
Track search-to-product-view, zero-result, and reformulation rates so successful searches do not hide shoppers who found nothing useful.
7. Build Cart Recovery Around the Reason for Abandonment
Klaviyo’s abandoned-cart benchmark analyzed more than 143,000 flows and found an average placed-order rate of 3.33%, with abandoned-cart flows producing the highest average revenue per recipient among the automated flows studied. The opportunity is real, but a generic sequence will not recover every cart for the same reason.
Send the first reminder while intent remains fresh, but do not lead with a discount by default. The next message can answer a likely objection with delivery information, product proof, or support access.
Reserve an incentive for a segment where price sensitivity is credible and the margin can support it. Coordinate email, SMS, and paid retargeting so the shopper does not receive the same message everywhere.
Track recovered revenue after discounts, plus returns and unsubscribes. A flow that trains shoppers to wait for coupons can weaken full-price conversion.
8. Prioritize Experiments With Evidence, Not Enthusiasm
A prioritization framework such as ICE can help, but the score should reflect evidence rather than confidence in the loudest idea. Impact comes from the size of the affected audience and the value of the behavior. Confidence comes from analytics, user research, support data, and previous tests. Ease includes engineering effort, QA risk, and the operational cost of maintaining the change.
Write the hypothesis before the design: “Because mobile shoppers cannot see delivery timing on the product page, adding a clear estimate near the CTA will increase add-to-cart rate without increasing checkout exits.” That statement defines the audience, the friction, the expected behavior, and the guardrail. It also makes an inconclusive result easier to learn from.
Do not declare a winner because a dashboard briefly turns green. Set the sample and runtime before launch, cover a full business cycle, and review revenue per visitor, margin, refunds, and technical errors alongside conversion. Low-traffic brands should often ship high-confidence usability fixes and measure the before-and-after result instead of waiting months for an underpowered test.
9. Personalize With First-Party Signals
McKinsey’s personalization research found that 71% of consumers expected personalized interactions and 76% felt frustrated when they did not receive them. That does not mean every visitor needs a different homepage. Useful personalization narrows the decision, remembers context, or changes the next best action.
Start with signals you collect directly: products viewed, category affinity, previous purchases, location, device, stated preferences, loyalty status, and return behavior. Use them to reorder recommendations, restore a recent journey, change replenishment timing, or show relevant education. Keep the logic explainable and give shoppers control over sensitive preferences.
10. Use the Returns Policy as a Pre-Purchase Trust Signal
A returns policy shapes conversion before a return exists. In Baymard’s 2026 abandonment data, 13% of shoppers cited an unsatisfactory returns policy as a reason for leaving checkout. If the policy is difficult to find or understand, a first-time buyer has to price that uncertainty into the purchase decision.
Summarize the window, cost, eligibility, refund method, and key exclusions near the product CTA and repeat the essentials in the cart. Keep the full policy available for detail, but do not force shoppers to translate legal language to understand whether they can return an item that does not fit. The promise must also match the operation, because a generous policy paired with a slow, manual process creates a different trust problem after purchase.
Measure first-time conversion, return behavior, and repeat purchase together. A clearer policy may increase legitimate returns as well as orders.
Extend CRO Beyond Checkout
CRO continues after payment. At this stage, the job shifts from winning the order to protecting it and making the next purchase easier through accurate edits, tracking, and returns.
Order confirmation and editing
Use the confirmation page to verify the order and offer only relevant additions. Allow a controlled window for address, size, or item changes, then track cancellations prevented and fulfillment exceptions.
Tracking and proactive communication
A branded tracking page keeps customers inside your experience, while proactive notifications answer questions before they become tickets. Shipment clarity should always take priority over promotion.
Returns and exchanges
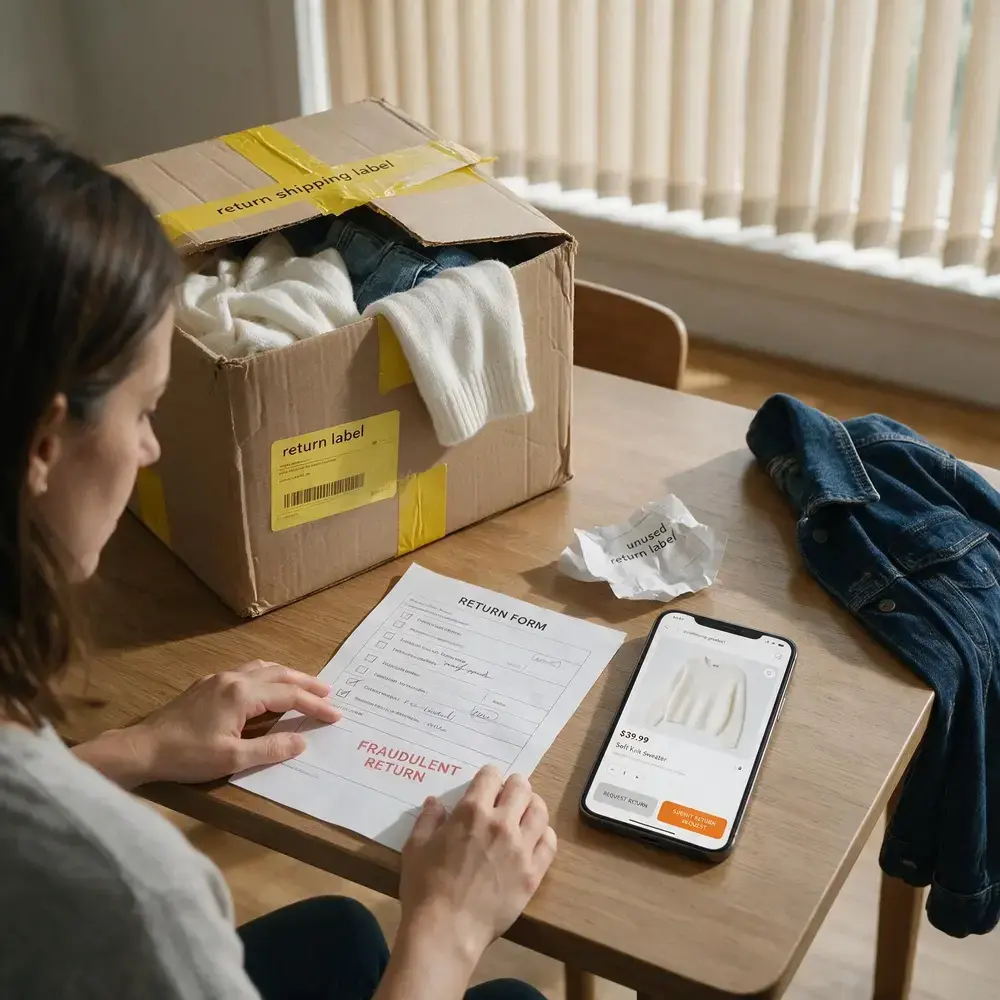
A self-serve return flow reduces effort, while relevant exchanges or store credit can retain revenue. Track resolution time, exchange value, repeat purchase, and fraud outcomes together.
Ecommerce CRO Prioritization by Traffic and Maturity
Traffic affects how quickly you can test, but it should not prevent you from improving obvious friction. Use the ranges below as planning bands rather than hard rules.
| Planning band | Prioritize now | Avoid for now |
| Under 20,000 monthly visits | Product-page clarity, checkout errors, guest checkout, mobile speed, returns-policy visibility | Running several simultaneous A/B tests with slow or inconclusive samples |
| 20,000 to 75,000 monthly visits | Cart recovery, search improvement, structured user research, tests on high-traffic templates | Spreading tests across low-volume pages or too many segments |
| More than 75,000 monthly visits | A managed experiment roadmap, personalization controls, post-purchase optimization, cohort analysis | Judging winners only on conversion without margin and return guardrails |
Where ClickPost Fits Into a CRO Program
ClickPost supports the post-purchase part of this framework rather than replacing your analytics or experimentation stack. Its branded tracking and proactive notification capabilities help brands manage order visibility,
while its Returns & Exchanges platform connects policy rules, self-service requests, exchanges, labels, tracking, and refunds. For Shopify brands, order editing can give customers a controlled way to correct or expand an order before fulfillment.
You can evaluate ClickPost against measurable outcomes such as WISMO contacts, cancellations, exchange value, repeat purchase, and support effort. Use post-purchase data to complete the journey rather than create another isolated dashboard.
Conclusion
Return to that Monday dashboard. Traffic and media spend had grown, but revenue had barely moved. Instead of adding more campaigns or small tests, locate the break in intent, fix the fundamentals, and measure the economics of the order.
Choose two or three strategies that match your data, assign an owner, and define success and guardrails before work begins. Then extend the same discipline into order editing, tracking, and returns so CRO supports profitable growth beyond the website.
Frequently Asked Questions About Ecommerce CRO Strategies
What is ecommerce conversion rate optimization?
Ecommerce CRO improves the share and value of visitors who complete a profitable action. It uses analytics, research, experimentation, and operational data to remove friction without increasing refunds or cancellations.
How do I calculate ecommerce conversion rate?
Divide completed purchases by eligible visits and multiply by 100. Calculate it separately by device, source, page, category, and customer cohort so a blended rate does not hide the problem.
Which ecommerce CRO strategy should I start with?
Start with the largest drop among visitors who already show purchase intent, usually on product pages or in checkout. Fix established usability problems before testing uncertain choices.
How long does CRO take to show results?
Usability fixes can change behavior immediately, but review them across a full business cycle. Controlled tests take longer because traffic, baseline conversion, and expected effect determine the sample required.
How can I reduce cart abandonment?
Show total cost early, make guest checkout obvious, remove unnecessary fields, preserve data after errors, and explain delivery and returns before payment. Use recovery messages to address the remaining objection.
Should low-traffic stores run A/B tests?
Low-traffic stores can test major templates, but small changes may take too long to validate. Ship high-confidence usability fixes and reserve formal tests for meaningful decisions with enough traffic.
How does post-purchase CRO affect conversion?
Post-purchase CRO protects the order and improves the path to another one. Track cancellation prevention, support demand, exchanges, and repeat purchase rather than treating checkout as the finish line.





We use cookies to keep the site working, understand usage, and improve your experience. Learn more
Always active for essential site performance and security.
Enables anonymous usage analysis to refine our services.
Used to present relevant promotions and advertising.