









Post-Purchase Experience Statistics 2026: US Shopper Insights



Ready to delight customers after checkout?
Trusted by 600+ brands
In this blog
TL;DR Summary
In FedEx's 2025 research, 90% of consumers said the post-purchase experience matters as much as product quality. Returns weigh heaviest, with 71% of online shoppers less likely to shop again after a poor returns experience.
-
19.3% is the share of US online sales retailers expected shoppers to return in 2025 (NRF and Happy Returns).
-
52% of US consumers have stopped buying from a brand after a bad product or service experience (PwC).
-
60% of Americans received damaged goods from an online order in the year to November 2024 (DS Smith and The Harris Poll).
-
$973 billion in US sales is at risk from bad customer experiences in 2026, the largest dollar figure of any country studied (Qualtrics XM Institute).
-
49% of US consumers say they are likely to use AI to track an order or delivery (PwC).
Most brands work hard to win the order. Shoppers judge them on what happens next. In FedEx's 2025 research, 90% of consumers said the post-purchase experience matters as much as the product itself. One late parcel, one silent tracking page or one slow refund can undo the goodwill a brand spent months building.
Post-purchase experience statistics for 2026 show exactly where that goodwill slips away. You will see how many US shoppers walk away after a bad experience and which delivery problems flood support teams with tickets. You will learn why returns now decide repeat purchases and how much retailers expect US returns to cost. You will also see how younger and older shoppers behave differently. Finally, you will get the category metrics worth tracking, a 2026 outlook and a master table of 30 sourced figures you can cite.
How Wide is the Loyalty Gap Between US Brands and Shoppers?
About nine in 10 US executives believe customer loyalty has grown in recent years. Only four in 10 consumers agree. PwC found this gap in its 2025 Customer Experience Survey of 5,511 US consumers and 406 executives. For post-purchase teams, the gap means leaders can easily miss problems in delivery and returns.
The same survey shows that 70% of US executives think customer expectations are changing faster than their company can adapt. Spending is rising, but measurement lags behind. 84% of executives have increased spending on customer loyalty, while 83% say they need better tools to measure what drives purchases. Post-purchase data such as delivery exceptions, order-status contacts and refund times can easily fall outside those systems.
Forrester’s independent scores point the same way. Its US CX Index fell for a fourth consecutive year in 2025, to an average of 68.3. Among brands Forrester rated in both 2024 and 2025, 25% declined significantly and only 7% improved. The 2026 results show an early recovery, which the trends section covers below. Our guide to signs your post-purchase experience is hurting your brand explains the internal blind spots in more detail.
How Do Poor Customer Experiences Affect Repeat Purchases?
52% of US consumers have stopped buying from a brand after a bad experience with its products or services. Another 29% stopped because of poor customer experience online or in person. These 2025 PwC findings cover the whole customer journey, so they include problems before and after checkout.
Qualtrics XM Institute puts a price on the damage. Its Q3 2025 study surveyed 20,001 consumers in 14 countries. It found that 11% of experiences go badly, and consumers cut spending after 47% of those bad experiences. US companies face the largest risk in dollar terms, with $973 billion in sales at risk in 2026. Mexico faces the highest share, at 8% of sales.
Customers mostly respond by spending less rather than leaving outright. Globally, Qualtrics expects consumers to cut about $2.1 trillion in spending and stop about $865 billion entirely. A single survey score rarely captures that slow decline. We recommend a sharper internal signal instead, namely repeat purchase rate in the 60 to 90 days after a delivery exception or return. The returns section covers the returns-specific findings.
What Do US Shoppers Expect After Checkout?
According to FedEx's 2025 E-Commerce Trends to Watch report, US online shoppers expect home delivery (81%), free shipping (76%) and real-time tracking (68%) as standard. NRF and Happy Returns' 2025 research adds that 82% of shoppers consider free returns an important factor when making an online purchase.
Together, these findings show what shoppers consider the baseline for a smooth online shopping experience. Here is how the two studies rank these expectations:
-
Free returns: 82% of shoppers consider them important.
-
Home delivery: 81% of shoppers expect this option.
-
Free shipping: 76% of shoppers expect it.
-
Instant refunds or exchanges: 76% of shoppers are more likely to choose a return option that offers them.
-
Real-time tracking: 68% of shoppers expect it.
How Often Do US Deliveries Go Wrong, and What Drives WISMO?
A delivery problem can affect how customers feel about an entire purchase. Sometimes the package arrives damaged. Other times, it arrives late or the tracking page stops showing updates. Both leave customers wondering what went wrong.
The scale of the damage is significant. A DS Smith and The Harris Poll survey of 3,071 US adults found that 60% had received a damaged online order in the year leading up to November 2024. Among these shoppers, 34% reported crushed packages, 34% reported torn packaging and 32% found the product smashed inside. DS Smith estimates that around 700 million packages arrive damaged in the US each year, with losses across the supply chain reaching roughly $48.5 billion.
But damaged parcels are only part of the delivery experience. Customers also get anxious when an order is late and they cannot see where it is. That uncertainty often leads to WISMO (Where Is My Order?) questions. According to Gorgias, these requests make up about 18% of incoming support tickets across its ecommerce customers. For some brands, they account for as much as 30%.
Retailers can answer many of these questions with timely tracking updates. Shoppers are also becoming more comfortable using AI for this purpose. In PwC's 2025 survey, 49% of US consumers said they would likely use AI to track an order or delivery. Only 29% said they would use it to make a payment. However, automation cannot replace human support entirely. The same survey found that 86% of consumers consider human interaction important in their brand experience.
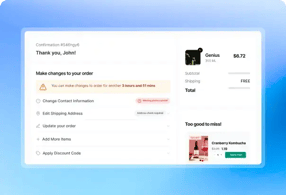
This gives retailers a clear direction. Keep customers informed before they feel the need to ask for an update, but make human help easy to reach when something goes wrong. Branded tracking pages and proactive delay notifications can help customers understand what is happening with their orders and what to expect next.
What Percentage of Online Orders Are Returned in the US?
Retailers projected that shoppers would return 19.3% of US online sales in 2025, compared with 15.8% of total retail sales, according to NRF and Happy Returns. That projection puts 2025 US retail returns at $849.9 billion. NRF estimated 2024 returns at $890 billion, or 16.9% of sales.
| Total US retail returns | $890 billion | $849.9 billion | Retailer estimate (2025 projected) | NRF and Happy Returns |
| Share of total retail sales returned | 16.90% | 15.80% | Retailer estimate | NRF and Happy Returns |
| Share of online sales returned | Not reported | 19.30% | Retailer projection | NRF and Happy Returns |
| Share of holiday sales expected back | Not reported | About 17% | Retailer expectation | NRF and Happy Returns |
| Share of returns that are fraudulent | Not reported | 9% | Retailer estimate | NRF and Happy Returns |
| Total merchandise returned | Not comparable | $706 billion | Research estimate | Appriss Retail |
Appriss Retail offers a second estimate. Its 2026 Total Retail Loss Benchmark Report, published in February 2026, puts 2025 returns at $706 billion. Appriss surveyed more than 1,000 consumers and analyzed returns across 250 million customer identifiers. Its scope and definitions differ from NRF's retailer survey, so avoid comparing the two totals directly. To track year-over-year performance, pick one dataset and stay with it.
Appriss also breaks the total down by channel. Buy online, return in store (BORIS) transactions account for $208 billion, or 29%. Appriss classifies $100 billion, or 14.2% of returns, as preventable loss. Returns abuse, meaning excessive but legitimate returns, makes up 12 points of that share, and outright fraud makes up 2 points. NRF's 9% figure measures something else, the share of returns that retailers classify as fraudulent. Keep the two numbers separate.
How Does the Returns Experience Affect Repeat Purchases?
A return can determine whether a customer shops with a retailer again. NRF and Happy Returns' 2025 research, based on a survey of 2,006 recent online returners, highlights how much the returns experience influences customer loyalty and buying decisions.
Here are the key findings:
-
Poor returns experiences hurt customer loyalty: 71% of US online shoppers say a poor returns experience makes them less likely to shop with that retailer again, up from 67% in 2024. Four in five would also tell friends and family about a bad experience.
-
Shoppers value quick resolutions: 76% of shoppers are more likely to choose a return option that offers an instant refund or exchange.
-
Free returns influence purchase decisions: The share of shoppers who consider free returns important rose from 76% to 82% in a year.
-
Return costs remain a concern for retailers: Among retailers that charge for returns, 40% cite rising processing costs, another 40% cite higher carrier costs, and 33% point to economic uncertainty or tariff risks.
-
Return behavior can create additional pressure: 45% of shoppers say it is acceptable to bend the rules when returning an item, especially when a purchase disappoints them.
These findings show why retailers need to make returns convenient without losing control of costs and revenue. As NRF's Katherine Cullen explained in the report's announcement, returns are no longer the end point of a transaction.
Retailers are responding in different ways. Some use customer-level return policies to distinguish loyal shoppers from those with excessive return patterns. Others offer exchanges before refunds, allowing shoppers to choose another size, color or product instead of immediately getting their money back. This gives customers a quicker resolution while helping retailers retain the sale.
ClickPost's returns and exchanges tools support this exchange-first approach.
How Do Younger and Older Shoppers Differ in Online Shopping and Returns Behavior?
Age influences how shoppers discover brands, engage with retailers and return products. Findings from NRF, FedEx and PwC highlight a few differences:
-
Younger shoppers make more online returns: US shoppers aged 18 to 30 made an average of 7.7 online returns over the past 12 months, more than any other age group, according to NRF and Happy Returns' 2025 research.
-
Gen Z engages with brands online: Nearly 70% of Gen Z's brand engagement happens online, according to FedEx. In comparison, 53% of Boomers prefer shopping in physical stores.
-
Social media plays a role in brand discovery: 51% of Gen Z shoppers discover new brands on TikTok, while 40% discover them on Instagram.
-
Brand values and online presence matter to younger shoppers: PwC's 2025 survey found that Millennials and Gen Z paid closer attention to a brand's values and online presence. Boomers placed less emphasis on social media and sustainability efforts.
Keep in mind that these age groups don't always align neatly with generations. NRF's 18-to-30 category includes both Gen Z and younger Millennials, so the 7.7-return figure does not apply to Gen Z alone. FedEx's finding about Boomers' preference for in-store shopping also doesn't tell us how they prefer to handle online returns or delivery updates.
For retailers serving different age groups, the best approach is to look at their own customer data. Compare return frequency, preferred return methods and support channels across age groups instead of assuming that every shopper in a generation behaves the same way.
What Post-Purchase Challenges and Metrics Matter by Ecommerce Category?
No primary public dataset reports US post-purchase performance by product category. NRF's blended 19.3% online return rate therefore remains the main external reference. The table below maps each category's most common post-purchase challenge to the evidence available and the internal metric worth tracking.
| Category | Common post-purchase challenge | Available external evidence | Metric to track |
| Apparel and footwear | Size-related returns, bracketing and exchanges | No public category return rate. NRF reports 45% of shoppers accept bending the rules on returns (all categories) | Return rate by SKU and size, exchange conversion rate |
| Food and beverage | Packaging damage and delayed deliveries | Food and drink are among the items most often damaged in online delivery (DS Smith, 2024) | Damage claims per 1,000 orders, reshipment rate |
| Health and beauty | Leakage, breakage and damaged packaging | Health and beauty are among the most frequently damaged categories (DS Smith, 2024) | Damage claims, refund and replacement rate |
| General merchandise | High order volumes and delivery exceptions | Online sales grew 21.6% year over year in Q2 2026 (Census data via Practical Ecommerce). Growth indicates volume, not support load | WISMO contacts per 100 orders, on-time delivery rate |
| Electronics | Transit damage, setup questions and high-value claims | No reliable public category benchmark found | Damage claim rate, support tickets per 100 orders |
What is the outlook for US ecommerce and returns in 2026 and 2027?
NRF projects that US retail sales in November and December 2026 will grow 4.2% to $1.013 trillion. It expects full-year 2026 retail sales to grow 4.4% to $5.6 trillion. Both figures are projections. The latest Census estimates put Q2 2026 ecommerce sales at $340.2 billion, up 12.2% year over year, while total retail grew 6.7%.
| Value | Classification | Source |
| $1.013 trillion, up 4.2% | NRF projection | NRF holiday forecast, Oct 15, 2026 |
| $5.6 trillion, up 4.4% | NRF projection | NRF Forecasts |
| About 17% | NRF and Happy Returns retailer estimate | NRF and Happy Returns, Oct 2025 |
| About $172 billion | ClickPost calculation using the 2025 rate* | ClickPost estimate |
| $340.2 billion (17.1% of retail) | Reported estimate, seasonally adjusted | US Census Bureau, Aug 18, 2026 |
*This ClickPost estimate assumes the 2025 holiday return rate of about 17% holds in 2026. We applied that rate to NRF's holiday sales projection, and NRF has not forecast this figure.
If that assumption holds, holiday 2026 could generate roughly $172 billion in returns. Retailers should plan for higher reverse logistics volume in the weeks after the holidays. Both baselines may also shift soon. The Census Bureau plans to publish its Q3 2026 estimate on November 19, and NRF says a new returns report is on the way. Our US holiday retail sales breakdown covers the demand side.
Which Post-Purchase Trends Will Shape 2026 and 2027?
AI-assisted order status with a human handoff
According to PwC, 58% of US consumers feel only somewhat comfortable or not comfortable at all using AI tools when interacting with brands. Still, nearly half are open to using AI to track an order. This suggests that shoppers are more comfortable letting AI handle simple tasks, such as checking delivery status, than relying on it for every interaction. PwC recommends using AI for routine tracking updates while making it easy for customers to reach a person when they need help.
Qualtrics president Brad Anderson makes a similar point in his Fortune column. As he puts it, "When efficiency is the only goal, companies build a commodity." For retailers, the takeaway is simple. Let automation handle routine status questions, but keep delivery exceptions, damaged orders and refund disputes in the hands of support agents.
Proactive delivery communication and more accurate delivery dates
Shipping-status requests can make up to 30% of incoming tickets for some ecommerce brands, according to Gorgias. Expect more retailers to send delay alerts before customers ask. Many will also show destination-specific delivery estimates on product and checkout pages, because carrier transit times vary by lane and season. Shoppers then judge the delivery against the date they saw before buying.
Faster refunds and exchange-first returns
Three in four shoppers (76%) prefer a return option with an instant refund or exchange. Refund speed is turning into a competitive factor in its own right. Expect more retailers to offer instant store credit, exchanges before refunds and faster refund triggers such as carrier drop-off scans. Retailers will likely keep slower, inspection-based refunds for high-value or high-risk items.
Risk-based returns management
85% of merchants say they use AI or machine learning to detect fraud in their returns process. Yet only 45% believe these tools work well on their own, according to NRF and Happy Returns. Appriss Retail found that 90% of consumers would buy again after receiving a warning about their return behavior. Together, these findings point toward policies that target specific abuse patterns and keep returns easy for most customers.
Rising CX quality also raises the bar. Forrester evaluated 225 US brands in both 2025 and 2026. Of those, 26% improved significantly while 7% declined, the first year-over-year rise since 2021. Overall scores still sit slightly below 2024 levels.
How to Benchmark Your Post-Purchase Experience?
Use this checklist to assess how well your post-purchase operations are working. These are internal checks, not industry benchmarks. A "no" answer highlights an area that may need attention.
1. Tracking and delivery
-
Do you regularly compare promised delivery dates with actual delivery dates?
-
Do customers receive delay notifications before they need to contact support?
-
Do you send updates through the communication channels customers have chosen?
2. Returns and refunds
-
Can customers find your return policy easily on product pages and in order confirmation emails?
-
Do you track how long it takes to issue a refund after a customer drops off a return?
-
Do you measure how many returns turn into exchanges instead of refunds?
3. Customer support
-
Do you measure WISMO contacts per 100 orders and track how much of your support volume they account for?
-
Can you identify which tracking events or delivery delays lead to the most WISMO queries?
4. Customer retention
-
Do you track how many customers make another purchase within 60 to 90 days after a return or delivery issue?
-
Do you measure post-purchase CSAT separately from overall customer satisfaction?
-
Do you compare satisfaction scores across product categories and age groups to identify where customers face the most friction?
Review these metrics regularly to spot recurring problems. They can help you identify where better tracking, faster returns or more responsive support could improve the customer experience.
Post-purchase Experience Statistics: Master table
| Statistic | Figure | Data period | Type | Source |
| Consumers who say post-purchase experience matters as much as product quality | 90% | 2025 | Survey finding | FedEx |
| Consumers who abandoned a purchase over an inconvenient shopping experience | 97% | 2025 | Survey finding | FedEx |
| Shoppers who expect home delivery | 81% | 2025 | Survey finding | FedEx |
| Shoppers who expect free shipping | 76% | 2025 | Survey finding | FedEx |
| Shoppers who expect real-time tracking | 68% | 2025 | Survey finding | FedEx |
| Gen Z shoppers who discover new brands on TikTok | 51% | 2025 | Survey finding | FedEx |
| Boomers who favor in-store shopping | 53% | 2025 | Survey finding | FedEx |
| US consumers who stopped buying after a bad product or service experience | 52% | May to Jun 2025 | Survey finding | PwC |
| US consumers who stopped buying over poor customer experience | 29% | May to Jun 2025 | Survey finding | PwC |
| US executives vs consumers who say loyalty has grown | About 9 in 10 vs 4 in 10 | May to Jun 2025 | Survey finding | PwC |
| US executives who say expectations evolve faster than they can adapt | 70% | May to Jun 2025 | Survey finding | PwC |
| US consumers likely to use AI to track an order | 49% | May to Jun 2025 | Survey finding | PwC |
| US consumers who say human interaction is important | 86% | May to Jun 2025 | Survey finding | PwC |
| Share of US online sales returned | 19.30% | 2025 | Retailer projection | NRF and Happy Returns |
| Total US retail returns | $849.9 billion (15.8% of sales) | 2025 | Retailer projection | NRF and Happy Returns |
| Share of holiday sales retailers expect back | About 17% | 2025 holiday season | Retailer expectation | NRF and Happy Returns |
| Share of returns that are fraudulent | 9% | 2025 | Retailer estimate | NRF and Happy Returns |
| Shoppers who call free returns important | 82% | Summer 2025 | Survey finding | NRF and Happy Returns |
| Shoppers more likely to pick an instant refund or exchange | 76% | Summer 2025 | Survey finding | NRF and Happy Returns |
| Shoppers less likely to return after a poor returns experience | 71% | Summer 2025 | Survey finding | NRF and Happy Returns |
| Average online returns per shopper aged 18 to 30, past 12 months | 7.7 | Summer 2025 | Survey finding | NRF and Happy Returns |
| Merchandise returned, with preventable loss | $706 billion, $100 billion preventable | 2025 | Research estimate | Appriss Retail, Feb 2026 |
| Americans who received damaged online goods | 60% | Year to Nov 2024 | Survey finding | DS Smith and The Harris Poll |
| Packages delivered damaged in the US each year | About 700 million, $48.5 billion | Annual estimate | Industry estimate | DS Smith, Nov 2024 |
| WISMO share of incoming ecommerce support requests | About 18% on average | Gorgias customer data | Platform estimate | Gorgias, updated Nov 2023 |
| Bad experiences that lead consumers to cut spending | 47% | Q3 2025 | Survey finding | Qualtrics XM Institute, Nov 2025 |
| US sales at risk from bad experiences | $973 billion | 2026 estimate | Research estimate | Qualtrics XM Institute, Nov 2025 |
| US brands with significant CX Index gains vs declines | 26% vs 7% | 2025 to 2026 | Index result | Forrester, Jun 2026 |
| US ecommerce sales | $340.2 billion, up 12.2% | Q2 2026 | Reported estimate | US Census Bureau, Aug 2026 |
| 2026 holiday retail sales | $1.013 trillion, up 4.2% | Nov to Dec 2026 | Forecast | NRF, Oct 2026 |
Conclusion
US shoppers now weigh delivery, tracking and returns alongside the product itself. A poor return ranks among the clearest reasons they give for not coming back. Yet most executives believe loyalty is improving while most consumers disagree. That gap suggests many brands still measure the post-purchase stage too loosely.
Start by connecting post-purchase events to retention. Track repeat purchase rate after returns and delivery exceptions. Measure WISMO contacts per 100 orders, then break both metrics down by category and customer age group. Once you see where tracking gaps, delays and slow refunds cost you repeat customers, you will know which part of the journey to fix first.
Post-purchase experience statistics: FAQs
What percentage of consumers feel anxious after making an online purchase?
No reliable US study in this article measures post-purchase anxiety directly. The closest indicators are importance and support volume. In FedEx's research, 90% of consumers rate the post-purchase experience as important as product quality. Gorgia's data shows WISMO questions make up about 18% of incoming ecommerce support requests on average.
What is the post-purchase experience in ecommerce?
The post-purchase experience covers everything after a shopper places an order. That includes confirmation messages, shipping updates, tracking, delivery, returns, refunds and support. In FedEx's 2025 research, 90% of consumers said it matters as much as product quality. That makes it a major factor in whether shoppers buy again.
How does a poor post-purchase experience affect customer loyalty?
71% of US online shoppers say a poor returns experience makes them less likely to shop with that retailer again, according to NRF and Happy Returns. More broadly, PwC found that 52% of US consumers have stopped buying from a brand after a bad product or service experience. That figure covers the whole customer journey.
What do customers expect after they place an online order?
81% of US online shoppers expect home delivery, 76% expect free shipping and 68% expect real-time tracking, according to FedEx's 2025 research. NRF and Happy Returns found that 82% consider free returns important. Another 76% prefer a return option with an instant refund or exchange.
What percentage of online orders are returned in the US?
NRF and Happy Returns projected that 19.3% of US online sales would be returned in 2025. Across all retail channels, the estimated return rate was 15.8%, representing $849.9 billion in merchandise. These figures are based on retailer estimates, and NRF plans to release updated data in its next returns report.
How does the returns experience impact repeat purchases?
71% of US online shoppers say a poor returns experience makes them less likely to shop with that retailer again. That share rose from 67% in 2024, according to NRF and Happy Returns. Fast resolution helps, since 76% are more likely to choose a return option with an instant refund or exchange.
What is a WISMO ticket and how does it affect customer satisfaction?
A WISMO ("where is my order?") ticket is a support contact about an order's location or delivery status. Gorgias data puts these at about 18% of incoming requests on average. Delayed scans, missed delivery estimates and unclear tracking all trigger them. Each one adds support cost and tests the shopper's patience.
How do younger and older shoppers differ in their online shopping behavior?
7.7 online returns in 12 months is the average for US shoppers aged 18 to 30, the highest of any age group, according to NRF and Happy Returns. FedEx found Gen Z conducts nearly 70% of brand engagement online and discovers brands on TikTok and Instagram. Meanwhile, 53% of Boomers prefer shopping in stores.



We use cookies to keep the site working, understand usage, and improve your experience. Learn more
Always active for essential site performance and security.
Enables anonymous usage analysis to refine our services.
Used to present relevant promotions and advertising.