.png?width=193&height=27&name=ClickPost%20Logo%20(Blue).png)
.svg)
.svg)
.svg)
.svg)
.webp?width=286&height=206&name=ROI%20Calculator%20(2).webp)
.svg)
.svg)
.svg)
.svg)
.svg)
.svg)
.svg)
.svg)
.svg)
.webp?width=286&height=206&name=Frame%201171276203%20(11).webp)
.svg)
.svg)
.svg)
.svg)
.webp?width=286&height=206&name=ROI%20Calculator%20(3).webp)
.svg)

.svg)
.svg)
.svg)
.webp?width=286&height=206&name=ROI%20Calculator%20(4).webp)
How to Reduce Warranty Claims: 7 Proven Strategies


Ready to delight customers after checkout?
Trusted by 600+ brands
In this blog
TL;DR Summary
U.S. manufacturers paid more than $30 billion in product warranty claims in 2025, at an average rate of 1.30% of sales. Ecommerce brands tend to run higher, from under 2% for apparel defects to 5 to 10% for general consumer goods.
Most claims trace to four causes, and each takes a different fix: manufacturing defects call for pre-ship quality control, transit damage for better packaging and carrier routing, user error for post-purchase onboarding, and fraud for verification at intake.
Supplier chargebacks push defect costs back to the vendor responsible. The rate falls when you match the fix to the cause rather than treating every claim alike, and it stays down when one person owns the number.
Introduction
Warranty claims behave differently in ecommerce than in traditional retail. A product that would have sat safely on a store shelf now travels through a sorting network, gets handled by several carriers, and lands on a doorstep, and some share of it arrives damaged.
The customer never sees the shelf version, so a dented unit reads as a defect and becomes a claim. That extra distance between the warehouse and the buyer is one reason online brands tend to report higher claim rates than the manufacturers who supply them.
The scale of the underlying cost is worth stating plainly. U.S. manufacturers paid $30.37 billion in warranty claims in 2025, at an average rate of 1.30% of product sales, per Warranty Week's analysis of SEC filings.
For an ecommerce operator, 1.30% is closer to a best case than an expectation. Transit handling, setup complexity, and broad DTC coverage terms each add claims on top of whatever the product itself generates.
In this guide, we cover how to calculate your claim rate by SKU, what drives it above benchmark, and seven strategies to reduce it, beginning with the packaging and fulfillment decisions behind the largest share of ecommerce claims.
What Is Warranty Claim Rate — And What Should Yours Be?
Before you can reduce warranty claims, you need a number to move. Warranty claim rate turns a messy pile of individual complaints into a single metric you can benchmark, trend, and take to leadership. Calculated at the SKU and supplier level, it also tells you where to point your first intervention.
How to Calculate Your Warranty Claim Rate
Warranty claim rate is the number of claims filed divided by the number of units sold, expressed as a percentage. Calculate it per SKU and per supplier, since a company-wide number can blend a failing product into the average and read as normal.
WCR (%) = (Total Claims Filed ÷ Total Units Sold) × 100
Worked example: if you sold 10,000 units and received 180 claims, your WCR is 1.8%. A rate that looks acceptable in aggregate can still hide a single SKU running at 6% or a supplier batch that failed in the field.
Warranty Claim Rate Benchmarks by Industry (2026)
A good warranty claim rate depends on the product category. The cross-industry average is 1.30%, but a consumer electronics brand and a furniture brand should not hold themselves to the same target. Use the ranges below as a starting reference, then benchmark against your own trailing 12 months.
| Product Category | Industry Average WCR |
Top-Performer WCR
|
| Consumer Electronics | 1–3% | Under 1% |
| Consumer Goods (general) | 5–10% | Under 3% |
| Furniture & Home | 2–8% | Under 2% |
| Apparel (defect claims) | Under 2% | Under 0.5% |
| Cross-industry average | 1.30% | Under 1% |
These benchmarks assume standard warranty terms. DTC brands with broad, no-questions coverage policies tend to trend toward the upper bound of each range, since a generous policy invites more claims.
What Causes High Warranty Claim Rates? The Four Root Causes
Warranty claims arrive as one undifferentiated pile of unhappy customers, and they don't share a common cause. A cracked screen and a botched setup are different failures, and the fix for one does nothing for the other. Before you can bring the rate down, you have to know which of four sources your claims are coming from.
1. Manufacturing defects. The product left the factory not matching its own build specification, whether that's a weak solder joint, an mis-cut part, or a bad component. These tend to arrive in clusters, since a single flawed production run ships to many customers at once.
2. Transit damage. The product was fine when it left the warehouse and broke somewhere between there and the doorstep. It's a leading driver for ecommerce specifically, where every order gets individually handled across a carrier network, and it sits almost entirely within operations' control.
3. User error and setup failure. The product works, but the customer couldn't get it running. This usually points back to the setup experience: unclear instructions, no getting-started guidance, a step that assumes knowledge the buyer doesn't have.
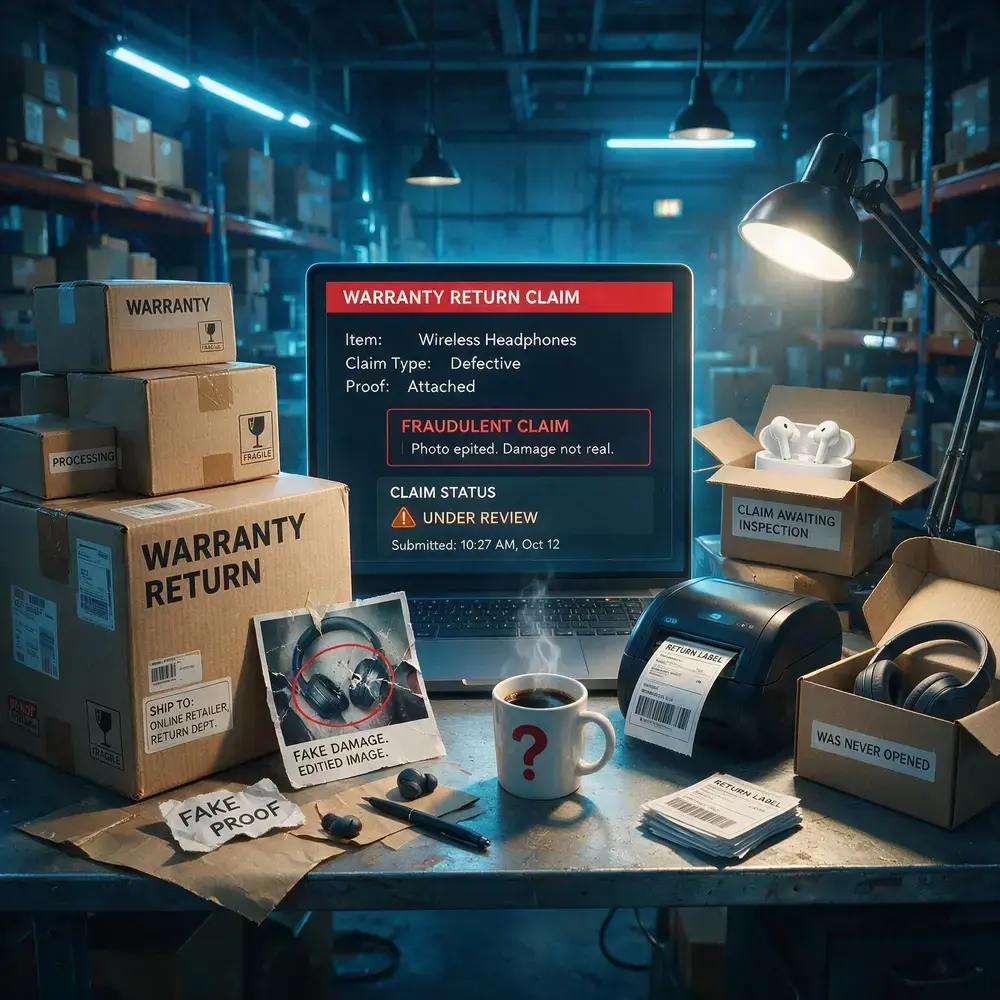
4. Warranty fraud. Ineligible or fabricated claims filed through normal channels. Warranty Fraud Management (Kurvinen, Töyrylä & Murthy) estimates fraudulent claims run 3 to 15% of a company's warranty costs, and the absolute cost climbs as claim volume grows.
Mapping your claims data to these four buckets is the first move, because the remedies do not overlap. Transit damage calls for packaging investment. User error calls for documentation investment. Confusing the two wastes budget on the wrong problem.
How to Reduce Warranty Claims: 7 Proven Strategies
Once you know which of the four causes is driving your claims, each one points to a specific fix. The seven strategies below run from the factory floor to the fraud desk. Match the ones that address your biggest cause first.
1. Fix Quality at the Source with Pre-Production and In-Production QC
A defective batch reaches a lot of customers at once. If a component is out of spec, every unit built from it carries the same flaw, and those units go out the door together. The claims come back together too, usually weeks later. That is what makes defects expensive: one mistake at the factory turns into dozens of claims you are now paying to resolve one by one.
Three checks catch most of it. Inspect incoming materials before they enter production. Sample units on the line while the run is happening. Do a final check before anything ships. Ask suppliers to report their own defect rates, so a problem surfaces in the data before it surfaces in a customer's hands.
2. Optimize Packaging and Pre-Ship Handling to Prevent Transit Damage
For an ecommerce brand, the box does real warranty work. About 20% of ecommerce returns come from products arriving damaged, and most of that damage happens because the product moved inside the box. Right-size the box so it can't shift. Add void fill suited to how fragile the item is. Flag your most breakable SKUs for extra protection.
Brands that track packaging-related returns and act on them cut those returns by 30 to 50% within two quarters. The fix is usually better-sized packaging, not costlier packaging.
3. Deflect Claims Before They Are Filed with Proactive Post-Purchase Communication
Some warranty contacts are setup problems in disguise. The product works, but the customer got stuck early, and filing a claim feels easier than digging through a manual to find the step they missed. Left alone, that confusion converts into a return or a defect claim against a product that was never faulty.
Well-timed messages catch the customer before that happens. Send a delivery confirmation, then a setup guide on day one, while the box is still open and the product is in front of them.
Check in around day seven, once they've had time to hit whatever the common snag is. Add a troubleshooting link for products complex enough to generate real questions. Each touch lands at a moment the customer might otherwise give up, so the answer arrives before the claim does.
4. Automate Claim Intake and Eligibility Verification
The cost of manual handling hides in the back-and-forth. A single claim runs an agent 10 to 45 minutes: reading the message, requesting a photo, confirming the purchase date, making the call.
A structured intake form front-loads all of that. Proof of purchase, serial number, and photo evidence come in with the submission, so eligible claims clear in seconds and agents keep their time for the cases that genuinely need judgment.
5. Use Warranty Data to Close the Product Feedback Loop
A single claim is one data point about one customer. A quarter of claims, grouped by SKU, supplier, and failure type, shows you which product is failing and where the fault sits. Most claim logs hold that signal already and never surface it.
Turning it into action takes structure. Schedule a warranty review each month with a named owner. Track claim rate by SKU and supplier. Flag any SKU over 3% for a root-cause investigation. Drop the owner or the shared dashboard, and the review fades off the calendar..
6. Implement Supplier Accountability and Chargeback Recovery
A failed supplier part lands on the brand's books by default, since no step in the standard process pushes the cost back to the party that caused it. Building that step is the fix. Capture the defect evidence at the moment the claim arrives. Aggregate claims by supplier each quarter. Issue a credit note request with the evidence attached. Then track recovery as a standing supplier metric.
What you recover turns on contract terms, so the rate swings widely between a supplier you can hold accountable and one you can't.
7. Detect and Prevent Warranty Fraud
Most brands never measure fraud, since flagging it feels like calling customers liars. The estimate cited earlier, 3 to 15% of warranty costs, scales up as claim volume rises. Basic controls catch the bulk of it. Match serial numbers to actual purchase records. Flag repeat claims from one customer. Send high-value claims to a human. Require a defect photo at intake. The calibration matters: thresholds set too tight turn honest buyers away, and that churn costs more than the fraud it prevents.
The Fulfillment Layer: Why Packaging and Transit Are Your Biggest Warranty Levers
Transit damage is the one major claim cause that sits almost entirely inside your own operation. A manufacturing defect involves the supplier. User error involves the customer.
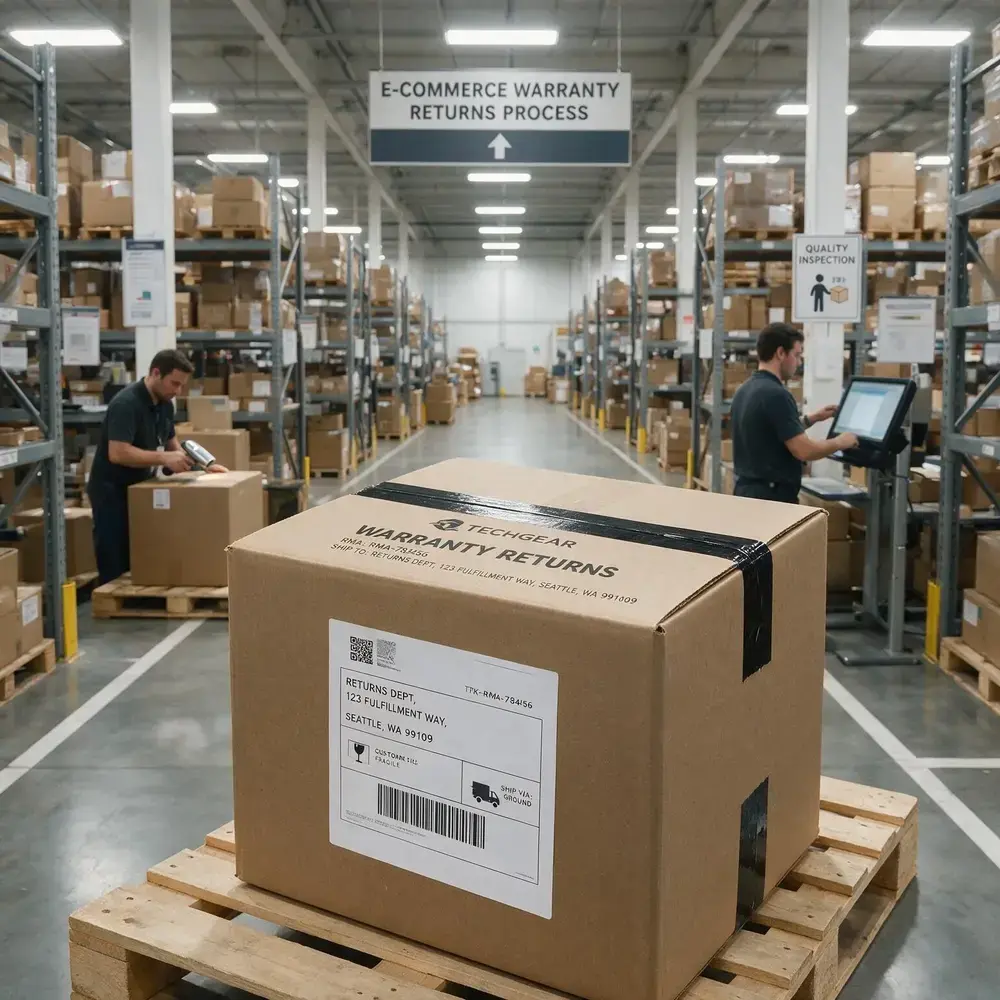
But a product that leaves the warehouse intact and arrives broken failed somewhere in a chain you control: the box it was packed in, the fill around it, the carrier that carried it, the route it took. That makes fulfillment the place where operational changes turn into fewer claims fastest, without renegotiating a supplier contract or rewriting a manual.
Four tactics do most of the work:
-
Audit packaging against your actual damage data. Pull your highest-claim SKUs and look at how each one is packed today. The pattern is usually the same: the box is too big, the fill is too thin, and the product moves. Fixing the fit is cheaper than upgrading the material and tends to matter more.
-
Track damage by carrier and by lane. The same SKU can arrive clean on one route and broken on another, because handling differs by carrier and by region. You can't see that in a blended damage rate. Tag each damage claim with the carrier and destination, and after a quarter the problem routes name themselves.
-
Route fragile SKUs deliberately. Once you know which carriers and lanes damage product, send your breakable items down the paths that handle them best. This costs nothing beyond the routing decision itself and takes claims off the board that packaging alone can't prevent.
-
Add a final check before dispatch. For fragile or high-value items, a quick inspection at the pack bench catches the wrong item, the missing part, or the already-cracked unit before it ships. A claim you prevent at dispatch is far cheaper than one you resolve after delivery.
For the Fulfillment Operations Manager: Transit damage is usually the single largest claim category for an ecommerce brand, and every lever above sits with whoever owns packaging spec and the 3PL relationship. If that role isn't tracking claim rate today, it's the fastest place to start.
Who Actually Owns Warranty Claim Reduction? Getting Organizational Accountability Right
Warranty claim reduction spans multiple functions because the factors that generate claims occur across the customer journey. Product quality determines how often defects occur. Fulfillment influences whether products arrive intact. Customer support shapes how claims are resolved and what patterns are surfaced back to the business. Procurement becomes relevant when supplier performance contributes to recurring defects.
Rather than assigning the metric to every team equally, many organizations designate a single business owner for warranty claim rate while relying on cross-functional inputs to improve it. The accountable function varies by organizational structure, but the responsibilities typically break down as follows:
CX Director
Sees the claims first and reads them for signal. The job here is spotting the recurring complaint hiding inside a stack of individual tickets, keeping resolution times and post-claim satisfaction where they should be, and making sure a pattern that points to a product fault actually reaches the team that can fix it.
Head of Ecommerce
Carries warranty claim rate as a headline number and connects it to returns and post-purchase performance. This role decides which avoidable claims are worth engineering out first, and it owns the supplier side of the problem, including the chargeback process that pushes defect costs back to the vendor responsible.
Fulfillment Operations Manager
Works the operational causes that show up only after a product ships: packaging that fails in transit, damage that clusters on certain carriers or lanes, handling errors in the warehouse, and the SKU-level failure patterns that surface once orders reach customers.
Warranty claim rate improves most reliably when one function is accountable for the number and the rest feed it what they see. The data lives in different places, so the owner's real job is less about issuing fixes than about making sure a signal caught in one team turns into action in another.
Your 30/60/90-Day Warranty Claim Reduction Roadmap
The plan below runs in sequence, because each phase produces what the next one needs. You diagnose before you intervene, and you can't judge an intervention until you have claim data from after the change.
Days 1–30: Diagnose. Establish the baseline you'll measure everything against.
-
Calculate current WCR by SKU and by supplier.
-
Map the last 90 days of claims to the four root causes.
-
Identify your three highest-WCR SKUs and check how each one is packed against a transit-simulation test.
Days 31–60: Intervene. Act on what the diagnosis surfaced, starting with the worst SKUs.
-
Launch a structured claim intake portal that captures evidence at submission.
-
Trigger a post-purchase onboarding sequence for the three problem SKUs.
-
Submit your first supplier chargeback with the defect documentation attached.
-
Turn on serial-number verification at intake.
Days 61–90: Optimize. Now that changes are live, measure whether they worked.
-
Review WCR weekly by SKU, watching the three you intervened on.
-
Compare damage and defect claims before and after the packaging changes.
-
Present the WCR trend to leadership with an ROI projection.
-
Name the single owner for the metric going forward.
Conclusion
Every strategy in this guide starts from the same move: sorting claims by what caused them, then spending against the cause instead of the symptom. That's what separates a brand whose WCR drifts down over two quarters from one that keeps paying for the same failure batch after batch.
The work isn't glamorous. It's a monthly data review, a tighter packing spec, a supplier credit note, a verification step at intake. But the payoff compounds, because a claim you prevent costs nothing to resolve, and a claim you resolve well can keep a customer you'd otherwise have lost.
Frequently Asked Questions About Reducing Warranty Claims
How do you reduce warranty claim rate in ecommerce?
Address all four root causes: prevent transit damage with packaging upgrades, cut manufacturing defects through pre-ship QC, deflect user-error claims with post-purchase education, and detect fraud at intake. Brands that run structured warranty analytics reduce claim rates 10 to 25% within two quarters.
What is a good warranty claim rate for consumer electronics?
A good warranty claim rate for consumer electronics is under 1%. The industry average runs 1 to 3%. Rates above 3% usually point to a systemic quality or transit-damage issue that warrants an immediate root-cause investigation at the SKU level.
How does automating warranty claims save money?
Automation cuts manual processing from 10 to 45 minutes per claim down to seconds for eligible cases, recovering roughly one agent-day for every 32 claims handled manually. At scale, that time saving lowers cost-per-claim and speeds resolution for customers.
What causes high warranty claim rates?
Four factors drive them: manufacturing defects, transit or shipping damage, user error from poor documentation, and fraudulent claims. Each needs a distinct operational fix. A single strategy cannot address all four, which is why diagnosis has to come before tactics.
How do you calculate warranty claim rate?
Warranty Claim Rate (%) = (Total Claims Filed ÷ Total Units Sold) × 100. For example, 180 claims on 10,000 units sold equals a 1.8% WCR. Calculate it separately by SKU and supplier so the number points to a specific intervention.
What is the difference between a warranty claim and a return?
A return is initiated by a customer who wants a refund or exchange. A warranty claim is initiated because a product failed or is defective within the warranty period. Claims may end in repair, replacement, or refund, and do not always involve sending the product back.
How can product documentation reduce warranty claims?
Clear setup guides, video tutorials, and in-box troubleshooting prevent user-error claims before they are filed. Paired with a post-purchase email sequence that delivers setup guidance at the right moment, documentation can deflect a large share of inbound support contacts.
What data should you track to reduce warranty costs?
Track warranty claim rate by SKU, root-cause category, time-to-resolution, cost-per-claim, supplier defect rate, and post-claim NPS. Together these six metrics show operations and CX teams where to intervene and whether each intervention is actually working.




We use cookies to keep the site working, understand usage, and improve your experience. Learn more
Always active for essential site performance and security.
Enables anonymous usage analysis to refine our services.
Used to present relevant promotions and advertising.