.png?width=193&height=27&name=ClickPost%20Logo%20(Blue).png)
.svg)
.svg)
.svg)
.svg)
.webp?width=286&height=206&name=ROI%20Calculator%20(2).webp)
.svg)
.svg)
.svg)
.svg)
.svg)
.svg)
.svg)
.svg)
.svg)
.webp?width=286&height=206&name=Frame%201171276203%20(11).webp)
.svg)
.svg)
.svg)
.svg)
.webp?width=286&height=206&name=ROI%20Calculator%20(3).webp)
.svg)

.svg)
.svg)
.svg)
.webp?width=286&height=206&name=ROI%20Calculator%20(4).webp)
Post-Purchase NPS: How to Measure It Across the Customer Journey


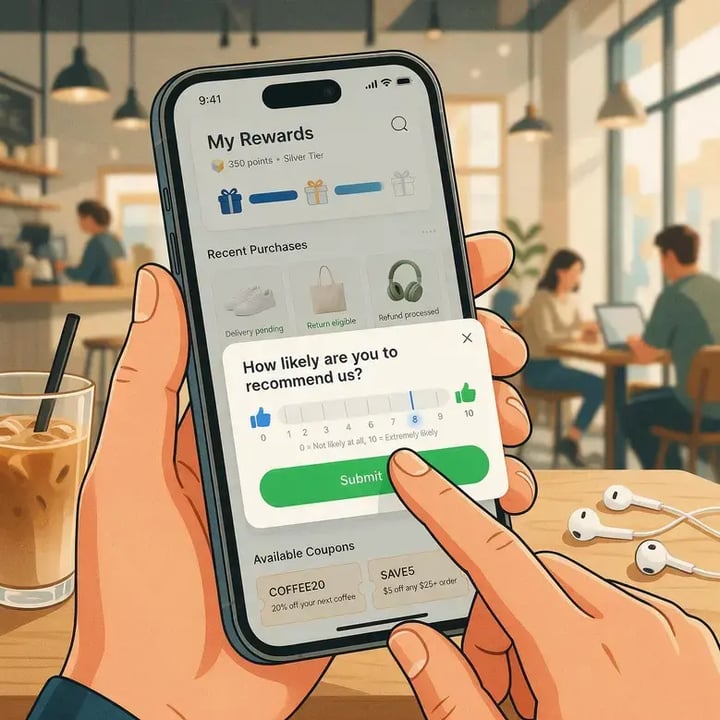
Ready to delight customers after checkout?
Trusted by 600+ brands
In this blog
TL;DR Summary
Post-purchase NPS is a transactional loyalty metric measured at discrete stages of the post-purchase journey, not a single survey sent after delivery. The journey has six measurable touchpoints: checkout confirmation, the pre-delivery buyer's remorse window, post-delivery, post-first-use, post-support resolution, and post-return.
For US ecommerce, a post-delivery NPS above +30 is healthy and above +50 signals a loyalty-generating experience. Retail and ecommerce NPS declined across 2024 to 2025 (Forrester), which raises the bar for what average means.
Each stage needs a different survey trigger, team owner, and closed-loop action. Connecting NPS segments to CRM automation, routing detractors to win-back flows and promoters to referral programs, is what turns a score into revenue.
Introduction
The average ecommerce NPS fell sharply between 2024 and 2025, and most brands are still measuring it wrong. Forrester's 2025 Global NPS rankings found scores falling in 20 of 39 industry-country combinations, with retail among the hardest hit. The instinct is to treat that number as a report card on checkout.
The better move is to treat post-purchase NPS as a measurement system with six separate stages. Each stage is owned by a different team, triggered by a different event, and read against a different benchmark.
Those stages split into two kinds of measurement. Transactional NPS (tNPS) fires after a specific event and captures how that one interaction felt. Relational NPS (rNPS) runs on a fixed cadence and captures how the whole brand relationship feels. Lump them together and your score just reflects when you happened to ask.
This guide shows you how to build that system. It walks through the six post-purchase stages worth measuring and, for each one, the healthy score range, the team that owns it, and the survey trigger and channel that actually fit the moment.
Then it gets into the closed-loop playbook, the part where a detractor turns back into a customer you keep. The point is to leave you knowing more than your score. You will know who should act on it and what they should do next.
Why Sending One NPS Survey After Delivery Is Leaving Signal on the Table
A single post-delivery survey collapses six distinct experiences into one number. Picture two customers. One loves the product but hates the support call. The other had a smooth delivery but a painful return. Both can land on the same score for opposite reasons, and averaging them tells you nothing you can act on.
Transactional NPS vs. Relational NPS: Two Different Questions
Transactional NPS measures how a specific interaction made the customer feel. Relational NPS measures how the brand relationship feels overall. Reading one as if it were the other produces scores that are unactionable for either purpose.
| Dimension | Transactional NPS (tNPS) |
Relational NPS (rNPS)
|
| Timing | Right after a specific event |
Fixed schedule, event-independent
|
| Trigger | Delivery, support close, refund |
Calendar (quarterly or annual)
|
| Purpose | Diagnose one interaction |
Track overall brand health
|
| Cadence | Continuous, event-driven |
Periodic snapshots
|
| Who owns it | Ops, CX, Support, CRM by stage |
CX leadership or VoC program
|
Ecommerce brands need both. Use tNPS at each post-purchase touchpoint to find the specific moment that is helping or hurting loyalty, and rNPS to watch the brand trend line over time. When you only run one relational survey a year, you learn that something went wrong roughly nine months after you could have fixed it.
Ecommerce NPS Benchmarks by Post-Purchase Stage
For ecommerce, a post-purchase NPS of +30 is considered healthy. Above +50 indicates the purchase experience is generating loyalty. Sub-+10 signals friction eroding brand equity. The direction of travel matters more than any single number.
Forrester's 2025 rankings documented an industry-wide decline, and retail and ecommerce took one of the steeper drops. Every benchmark was measured differently, so let them point you in a direction instead of setting one as your goal.
| Stage | Healthy Score Range | Friction Signal | Note |
| Post-checkout | +40 or above | Below +25 |
Measures confirmation clarity, not fulfillment
|
| Post-delivery | +30 minimum | Below +10 |
Baseline experience signal
|
| Post-support | +40 or above | Score drops vs. pre-support |
Support should lift, not lower, the score
|
| Post-return | +20 or above | Below +10 |
Returns depress scores; recovery above +20 shows trust survived
|
Channel choice moves response rates as much as the questions do. SurveyMonkey's 2025 platform data puts email surveys near 49 percent and SMS around 19 percent. That email number is high for a reason. It reflects opted-in audiences who already recognize the sender.
Look across broader industry research and the pattern usually flips. SMS pulls the strongest response. In-app lands in the middle. Email trails. Match the channel to the stage instead of defaulting to whatever you used last time.
That decline is not random. The usual drivers are delivery expectations that keep rising, inflation-related friction on returns, and survey fatigue from over-asking. A post-delivery NPS of +30 and a post-return NPS of +30 are not the same result. The return score is a recovery win. The delivery score is a baseline you should already be clearing.
The 6-Stage Post-Purchase NPS Journey Map
Here is how to measure NPS at each post-purchase touchpoint. Each stage lists its trigger event, survey timing, channel, healthy score range, team owner, and the closed-loop action a detractor or promoter should set off.
1. Post-Checkout NPS
Trigger: order confirmation.
Timing: within 30 minutes.
Channel: in-app or email. Healthy: +40 or above.
Owner: CX.
Action: if a customer scores as a detractor, flag for proactive pre-delivery outreach before anxiety peaks.
2. Pre-Delivery / Buyer's Remorse NPS
Trigger: 24 to 48 hours post-purchase, before delivery.
Timing: day 1 to 2 post-order.
Channel: SMS. Healthy: context-dependent, low response expected.
Owner: CX / Retention.
Action: detractors here signal purchase regret; route to educational content or easy cancellation to cut returns and protect NPS at delivery.
3. Post-Delivery NPS:
Trigger: carrier delivery-confirmation event.
Timing: physical goods 3 to 7 days, digital 24 to 48 hours, high-consideration 14 to 30 days.
Channel: SMS for high-AOV, email for subscription.
Healthy: +30 minimum.
Owner: Ops / CX. Action: detractors go to support triage, promoters trigger the referral program.
4. Post-First-Use NPS:
Trigger: first meaningful product engagement, such as a registration or an opened subscription box.
Timing: varies by product.
Channel: in-app or email.
Healthy: +35.
Owner: CX.
Action: a detractor here points to a product-experience gap, not a fulfillment one; route to the product feedback team, not support.
5. Post-Support NPS:
Trigger: ticket resolution or chat close.
Timing: within 1 hour of resolution.
Channel: email.
Healthy: +40, because a support interaction should improve the experience.
Owner: CX / Support.
Action: If the score drops after support, the interaction makes things worse. Escalate the issue to the support lead and log it for QA.
6. Post-Return NPS:
Trigger: refund confirmed or exchange shipped.
Timing: 24 to 48 hours post-refund confirmation.
Channel: email.
Healthy: +20 or above, since returns naturally depress scores.
Owner: Ops / CRM. Action: a promoter after a return is a high-LTV signal; route to a retention flow, never a churn assumption.
Action: Promoters enter a retention flow; low scores are flagged for return-experience review.
The six touchpoints, checkout, pre-delivery, post-delivery, post-first-use, post-support, and post-return, each measure a different dimension of the experience.
That is why one survey cannot stand in for all of them. A great delivery score tells you nothing about whether your returns process is quietly manufacturing detractors.
Measuring NPS at the Returns Moment
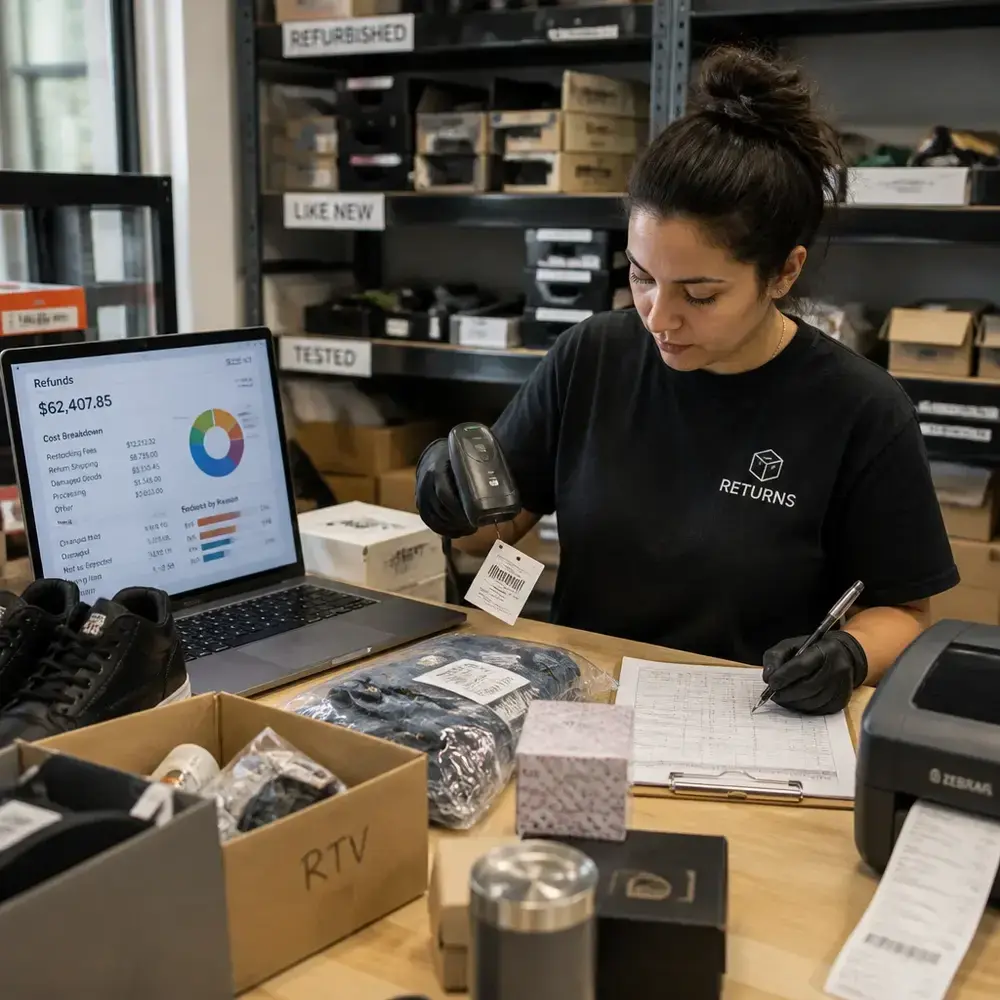
The National Retail Federation with Happy Returns put 2025 retail returns at 15.8 percent of annual sales, with ecommerce return rates higher at an estimated 19.3 percent. Brands in high-return categories are ignoring their most emotionally volatile post-purchase moment.
Return-policy design changes the score before the survey even fires. Segmenting return policies by customer tier, so a high-LTV buyer and a first-time buyer are not treated identically, directly affects what NPS a given return produces.
A customer who completes a return and still gives a 9 or 10 is among the highest-LTV segments in ecommerce. A brand that never measures post-return NPS misclassifies that loyal customer as churned.
The recovery economics favor investment. Closing the loop fast, ideally within a day of the survey, is what turns an unhappy customer back into a retained one. Speed is the message.
There is also a product-design lever here. Offering an exchange rather than a refund tends to produce a higher post-interaction score. The customer leaves with a solution instead of a reversal.
Post-Purchase NPS Closed-Loop Playbook: Step-by-Step Checklist
How to close the loop with NPS detractors in ecommerce, in six operational steps:
-
Classify the response by severity (0-3 critical, 4-6 at-risk) and theme (delivery, product, support, returns) using text analysis of the open-end follow-up.
-
Open a support ticket and assign a named owner within 4 hours of submission.
-
Set a resolution SLA of 24 hours for customers above your top-20 percent LTV threshold, 48 hours for everyone else.
-
Contact the detractor through the same channel they received the survey on, not a generic template.
-
Log the resolution in CRM against the customer record with a timestamp and a response classification.
-
Re-survey at 30 days to measure recovery. Fast closed-loop programs recover a meaningful share of detractors, and the effect concentrates in the first 24 to 48 hours.
How Clickpost AI Turns Post-Purchase NPS Into Revenue Actions
NPS is really a satisfaction score in disguise. And after someone buys, satisfaction mostly comes down to what happens between the order shipping and the box showing up. Get that part right and the score tends to follow.
That part is ClickPost's job. Each feature targets a spot where customers usually get annoyed.
-
Branded order tracking. The tracking page looks like you, not the carrier, so the wait still feels like your experience instead of a handoff to a stranger.
-
Estimated delivery dates on the tracking page. People can see when their order will arrive. No guessing, and far fewer "where is my order?" tickets.
-
Post-delivery NPS survey. Once the order lands, ClickPost sends a quick rating request and catches how the customer feels while it is still fresh.
None of this is complicated. You have made the wait clearer and the arrival smoother, and satisfied customers rate you higher. That is where a better NPS actually comes from.
Conclusion
Measuring NPS at one point in the post-purchase journey is like running one financial report a year. It is structurally too thin to make operational decisions on. The six stages split ownership cleanly: Ops owns delivery NPS, CX owns support NPS, and CRM owns returns NPS along with the downstream marketing automation.
The brands outperforming on post-purchase NPS in 2025 are the ones treating it as a routing system for CRM actions, not a scorecard to present quarterly. Post-purchase NPS is only as valuable as the infrastructure that receives the score.
Without closed-loop routing to the right team and the right CRM action, it is a metric with nowhere to go. Clickpost gives your post-purchase NPS data somewhere to go.
FAQs
What is post-purchase NPS?
Post-purchase NPS is a transactional loyalty metric. It measures how likely a customer is to recommend a brand based on a specific interaction, such as a delivery, a support resolution, or a return. It differs from relational NPS, which measures overall brand sentiment on a fixed cadence.
What is a good post-purchase NPS score for ecommerce?
A post-delivery NPS above +30 is considered healthy for ecommerce, and above +50 signals active loyalty. Retail and ecommerce NPS declined across 2024 to 2025, per Forrester's rankings. Sub-+10 at any post-purchase stage signals friction that needs operational attention.
When should you send an NPS survey after a purchase?
Timing depends on product type. Digital products: 24 to 48 hours post-purchase. Physical goods: 3 to 7 days post-delivery confirmation. High-consideration purchases: 14 to 30 days post-delivery. Subscriptions: 5 to 10 days post-ship. Surveys sent before delivery measure anxiety, not experience.
What is the difference between transactional NPS and relational NPS?
Transactional NPS is triggered by a specific event and measures that interaction. Relational NPS is sent on a fixed schedule, quarterly or annually, and measures overall brand sentiment. Ecommerce brands need both: tNPS at each post-purchase touchpoint and rNPS to track brand health over time.
How do you calculate Net Promoter Score?
NPS equals the percentage of promoters (scored 9 to 10) minus the percentage of detractors (scored 0 to 6). Passives (7 to 8) are excluded. Scores range from +100 to -100. Most ecommerce benchmarks treat anything above +30 as a positive signal.
How do you close the loop with NPS detractors in ecommerce?
Classify by severity and assign a ticket owner within 4 hours. Set a 24 to 48 hour resolution SLA by customer tier. Contact the customer through their original survey channel, log the resolution in CRM, and re-survey at 30 days. Automated workflows recover far more detractors than slow manual follow-up.
How often should you send NPS surveys to customers?
Apply throttling: no single customer should receive an NPS survey more than once every 30 days, regardless of purchase frequency. Without throttling, high-frequency buyers hit survey fatigue, which depresses response rates and inflates detractor scores.
How does post-purchase NPS affect customer retention?
A 5 percent improvement in retention can raise profits by 25 to 95 percent, per Bain & Company research published in Harvard Business Review. Post-purchase NPS is a leading indicator of retention risk. Customers who score 0 to 6 after delivery churn at higher rates within 90 days. Routing detractors to win-back flows is the direct link between NPS and retention.




We use cookies to keep the site working, understand usage, and improve your experience. Learn more
Always active for essential site performance and security.
Enables anonymous usage analysis to refine our services.
Used to present relevant promotions and advertising.