-1.webp?width=960&height=720&name=Frame%20(1)-1.webp)
In this blog
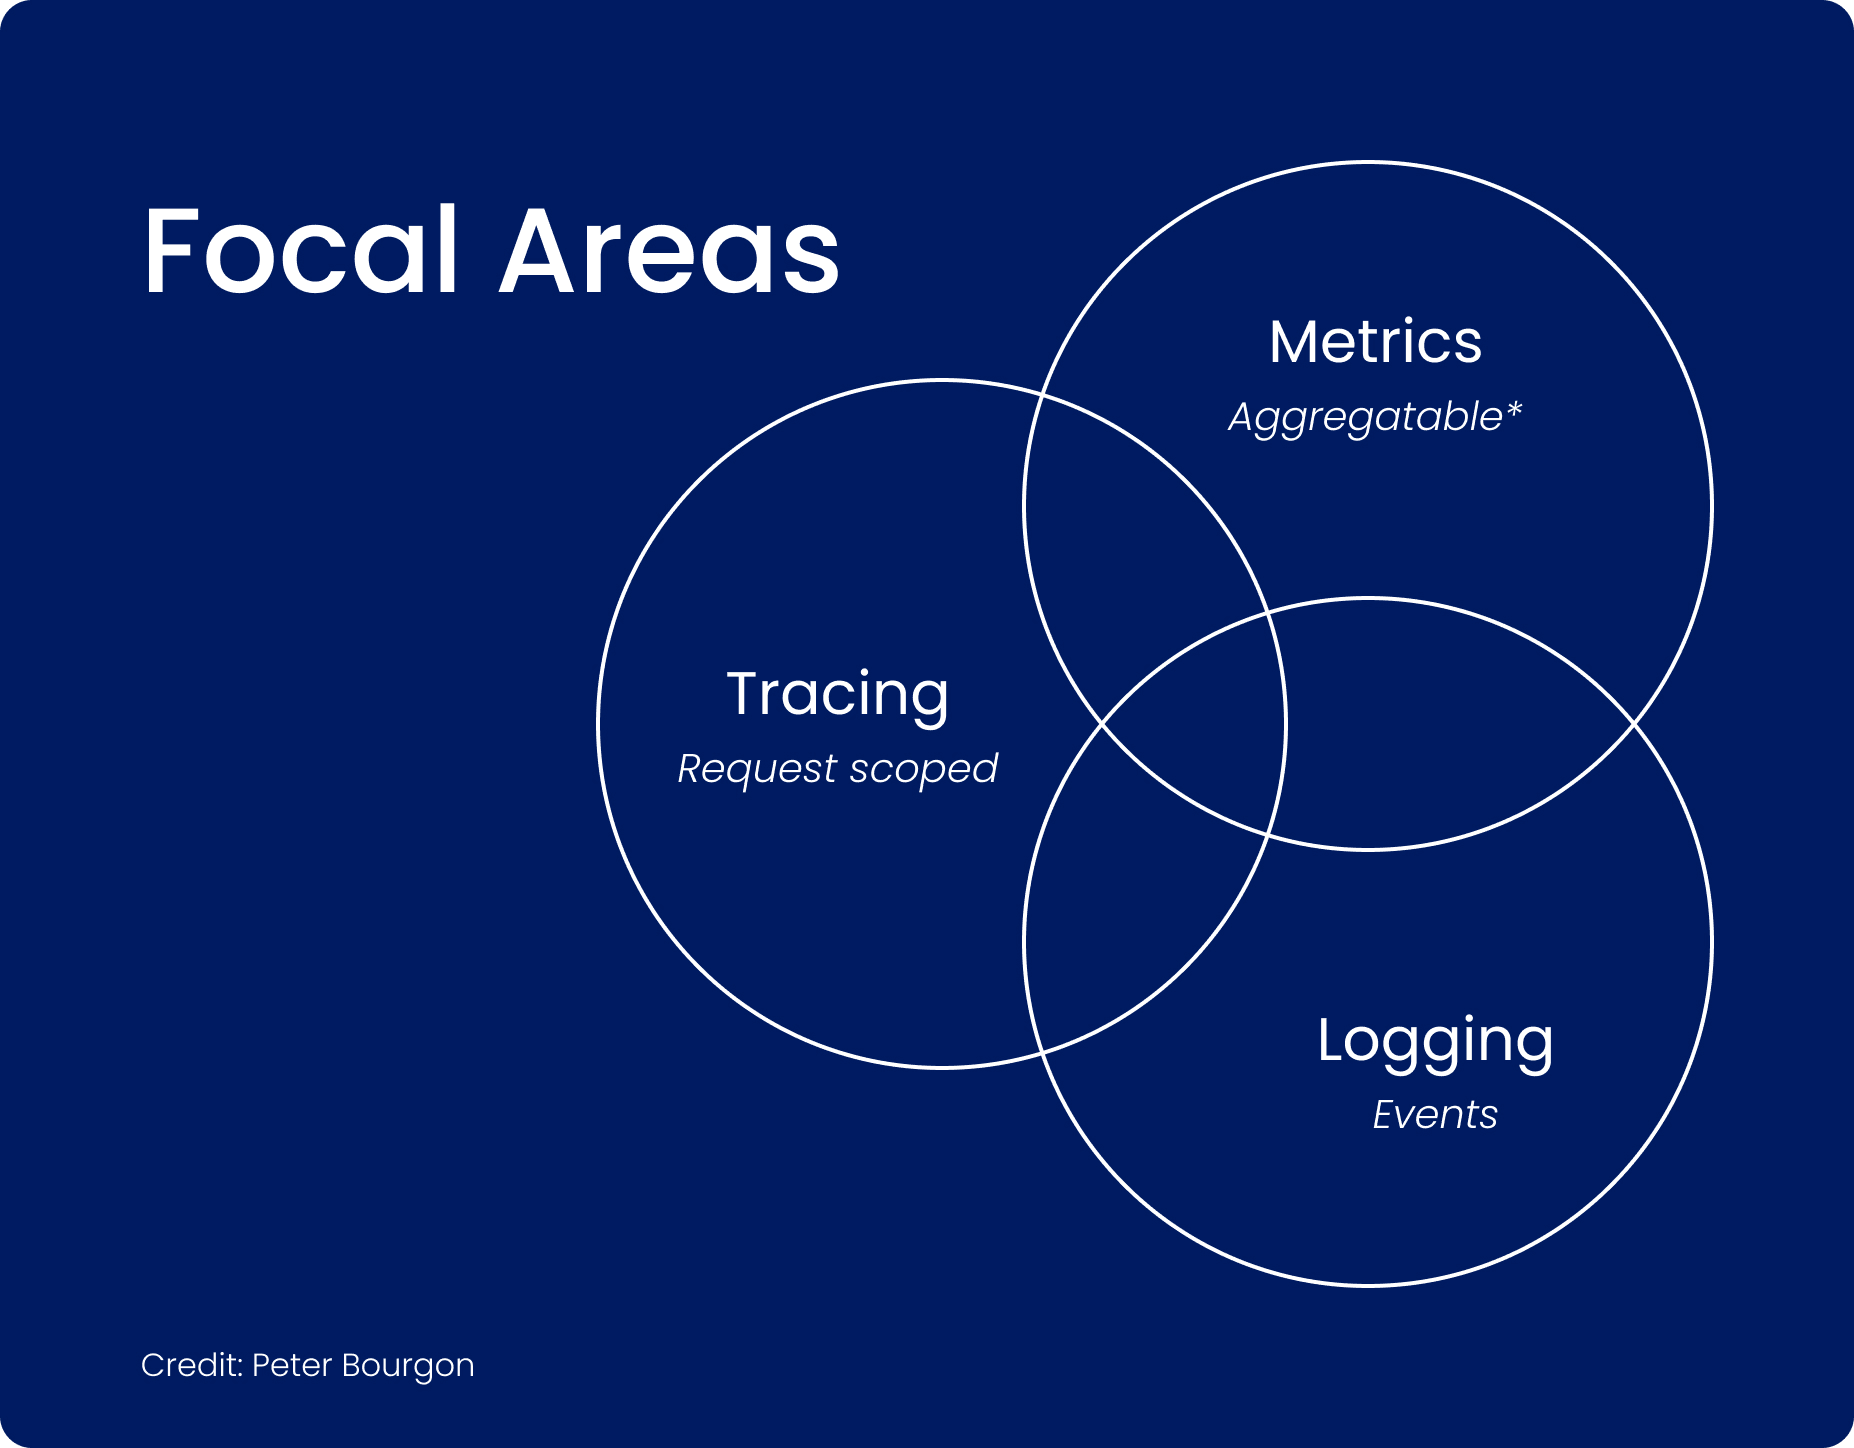
“Monitoring tells you when something is wrong. Observability helps you understand why.”
The “Why”: From Monitoring to Observability
You might wonder, “Don’t we already monitor our services?”
While monitoring is a standard practice, it’s reactive. It answers basic questions like “Is my API returning 200s?” or “Is CPU usage high?”, but when issues arise, you’re left sifting through logs and metrics.
Observability, on the other hand, is about understanding your system deeply enough to answer new, unanticipated questions quickly. It provides insights before problems arise, rather than just tracking them after. That’s the journey we started at ClickPost.
The Challenge: High Cost and Low Control
We started with New Relic, but over time, it became clear it wasn’t right for us. The costs were high especially after estimating usage through the New Relic pricing calculator and we lacked control over critical aspects like trace retention and data residency. Additionally, its lack of flexibility made it difficult to customize trace ingestion. We needed a solution that was affordable, customizable, and scalable. Hence, we decided to build our own.
We needed answers quickly, not just more dashboards. So, we built our own solution.
The Stack: Open-Source Observability at Scale
To create a solution that met our needs, we turned to open-source tools. The foundation of our system is OpenTelemetry, combined with tools like Grafana for visualization and Prometheus for metrics. We deconstructed a $100k+ observability SaaS offering and rebuilt it in-house; for a fraction of the cost, and full control.

The How: Instrument Everything
Instrumentation was our first step. We used OpenTelemetry’s auto-instrumentation to track data from Java and Python services. For our highly-used Kafka service, we manually instrumented it to get an end-to-end trace of our transactions. This setup ensures we can track and visualize every critical aspect of our system.
We used OTLP GRPC exporters to forward trace data to our custom local OpenTelemetry Collector. The Collector was configured with a memory limiter and batch processor to control resource usage and avoid overwhelming future components like Prometheus and Tempo.
The Real Magic: Collector + Trace-to-Metrics
Once we started sending the traces to the Collector, it worked its magic by converting spans into Prometheus metrics. This gave us the ability to easily track metrics like request counts, latencies, and error rates without needing to write custom metric code.
At the same time, we used the default OTTL Language for simple transformations on the received OTel data in the collector. This enabled custom views without adding complexity. Now, we can create customized dashboards that fit our needs.
Going Deeper: Tailoring Observability to Our Needs
While OpenTelemetry provided a strong foundation, we needed more. Two pain points stood out:
1. Breaking Down Parent Traces
Large parent traces often collapsed important details. We couldn’t easily segment them by consumer name, trace parent name, or other dimensions. To solve this, we built a custom Go-based processor plugin inside our own distribution of the custom OpenTelemetry Collector. This plugin injected extra metadata into spans, allowing us to slice traces more intelligently. Suddenly, instead of staring at a flat parent trace, we could break it down into meaningful segments and analyse them with query languages and beautiful dashboards.
2. Fixing Noisy Span Names
Out-of-the-box instrumentation often gives you generic span names like HTTP GET or SELECT. That works for basic tracing, but when you’re viewing them at a glance, it becomes noisy and hard to interpret. We wanted spans that were human-readable and directly tied to business logic. In Python, we forked opentelemetry-python-contrib, modified the span naming logic, and deployed our fork across services. In Java, we achieved the same using OpenTelemetry extensions, overriding default span names for HTTP operations. The result: our traces told a clear story instead of drowning us in noise.
These two changes — segmentation and human-readable span names — gave us clarity beyond most commercial APMs. Developers could debug faster, understand flows at a glance, and trust what the traces were saying.
Dashboards That Tell Stories
Metrics and traces are only as good as the insights you can derive from them. For us, Grafana wasn’t just a place to dump numbers — it became the canvas where system behavior turned into stories that engineers could act on. Here’s how we structured our dashboards:
Traces in Grafana
We started with the foundation: traces.
With Tempo’s out-of-the-box integration in Grafana, we could drill into a single request — from the incoming API call all the way to the database query.
Instead of chasing logs in the dark, traces lit up the system’s flow like a map.

APM Dashboards
On top of traces, we layered APM-style dashboards to get a high-level view of application health. These boards became our quick pulse check:
-
Request rates, error distributions, latency percentiles
-
Heatmaps catching tail latencies that averages usually hide
-
Request distribution charts showing which routes were really driving system load
This way, we could quickly tell if a spike in latency was because of DB queries… or just uneven traffic.


Segment Breakdown Dashboards
But sometimes, a parent trace was just too broad to be useful.
So, we built segment breakdown dashboards from our custom collector.
This gave us the power to slice traces by:
-
API route
-
Consumer
-
Or other attributes we cared about
From there, we had span-level insights of a particular trace along with pie charts of load share and latency distributions (P5/P50/P95).
-
Which DB operations were the real bottlenecks
-
Which consumer was causing latency spikes right now
In short — it gave us the “why” behind the trace.

JVM Metrics Dashboards:
Finally, we complement traces with JVM-level dashboards for our Java/Kotlin services. These cover CPU utilization, heap memory trends, thread states, and garbage collection behavior. Instead of waiting for “Out of Memory” errors, we can proactively watch heap usage patterns. Thread breakdowns help us identify bottlenecks like blocked threads or runaway pools before they escalate.

Together, these dashboards create a multi-layered view — from a single slow query in a trace, to its impact on latency distributions, to JVM resource pressure on the host. They don’t just surface metrics; they let us connect dots, explain behavior, and make performance actionable.
Why We Invested
As Andrew Mallaband puts it in his excellent piece Counting the Cost of Inaction: A Financial Case for Investing in Observability:
We saw this first-hand. Outages don’t just drain revenue — they pull engineers away from building new features, frustrate customers, and create cascading risks.
That’s why we invested the time to build observability right, in-house.
Cost vs Power: Why This Was Worth It
Yes — building our system took time and effort. But the benefits far outweighed the challenges. Beyond saving costs, we gained flexibility, transparency, and long-term control.
This isn’t just an observability platform. It’s an investment in resilience and cost predictability.
What’s Next
We’re not stopping here. As our system evolves, we’ll continue to add new features. Here’s what’s on the roadmap:
-
Frontend Telemetry: Introduce browser-side tracing with OpenTelemetry JS to capture page loads, API calls, and user interactions—giving us end-to-end visibility from click to backend.
-
EDA Instrumentation: Extending instrumentation to other event-driven architectures flows like RabbitMQ.
-
Logging Pipelines: Integrate Loki for advanced logging and correlation with traces and metrics.
-
Custom Flows: Perfecting flows to comprehensively visualize entire transactional journeys across services.
-
AI/ML-assisted Detection: Experiment with Grafana Machine Learning plugins for anomaly detection and forecasting in metrics.
We’ll keep improving our observability system to stay ahead of our needs.
Why You Should Care
If you’re at a startup or scaling business, you know how critical observability is. But observability doesn’t have to break the bank; it can be tailored to your business needs
-
Don’t overspend on external tools with limited control.
-
Build a system that fits your specific needs.
-
Own your data, own your insights.
Take it from us: observability is not optional.
And when you build it yourself, you don’t just see your system — you own your visibility.