
The Great Indian Festive Report 2026, just dropped! Read it here

AI-Powered Carrier Allocation Platform for Ecommerce

Optimize ecommerce shipping with ClickPost’s AI carrier allocation software. Select the best courier using cost, SLA, performance, and RTO data.

22 %
Lower shipping costs
31 %
Faster deliveries
Carrier Allocation Platform - Banner Image

Trusted by 600+ global brands

PUMA - SVG - 50
Oriflame - SVG - 50
Adidas - SVG - 50
Herbalife - SVG - 50
Birkenstock - SVG - 50
Sotheby - SVG - 50
The Body Shop - SVG - 50
  • Pilgrim - Case Study Banner
    ClickPost's AI Allocation automatically routes orders to our best-performing carriers in each region. It's like upgrading from a tricycle to a sports bike.
    anirudhlikhite

    Anirudh Likhite

    SVP Supply Chain and Procurement, Pilgrim

ClickPost eliminates guesswork in ideal
carrier allocation

fi_17064735

Automated carrier allocation

Set your rules or use our AI to optimize allocation and free up resources.

fi_1930265

Carrier performance insights

Move away from manual excel based carrier performance mapping.

fi_1762682

Reduce your RTOs

Choose the right carrier automatically based on multiple parameters and recent data to increase conversions.

Choose the right allocation strategy for your
business

Performance based allocation driven by ClickPost’s AI algortithm

  • Icon Leverage ClickPost’s algorithm to analyze millions of shipments.
  • Icon (1) Algorithm selects the best carrier based on speed, SLA adherence, RTO rates, and pricing.
  • Icon (2) Automate decisions and maximize delivery success.
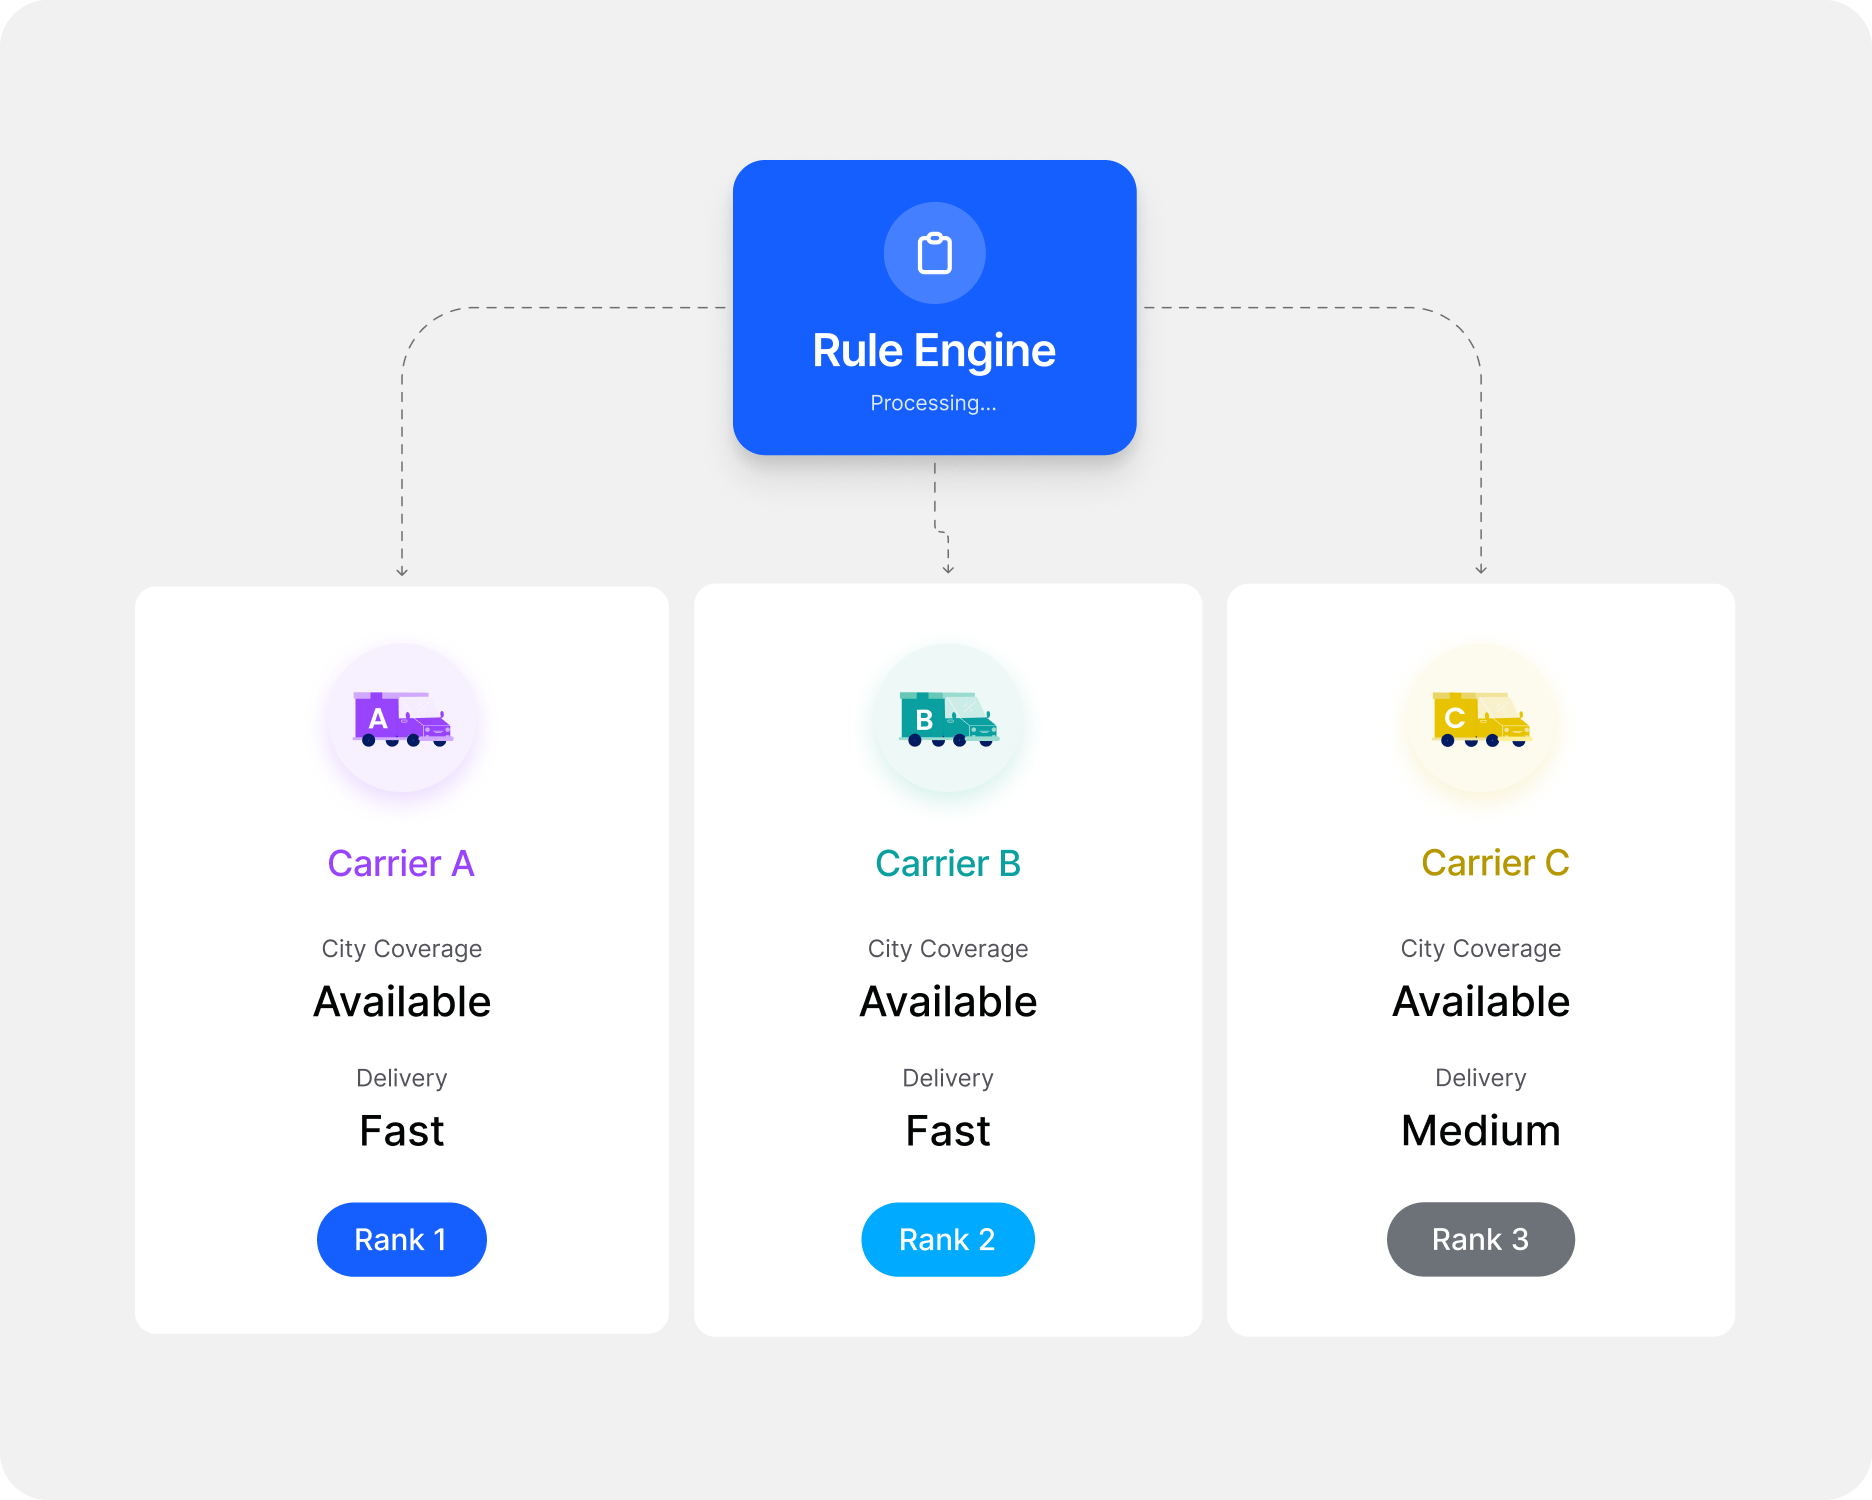
Rules based allocation for brands with defined business logic - Banner

Rules based allocation for brands with defined business logic

  • Icon (3) Define custom rules by delivery zone, weight, cost, or COD availability.
  • Icon (4) Prioritize which rules matter to your business, ClickPost applies them in order.
  • fi_487997 Automate carrier allocation to save time and money.

With ClickPost’s AI powered allocation,
let data drive smarter decisions

Icon - 2312

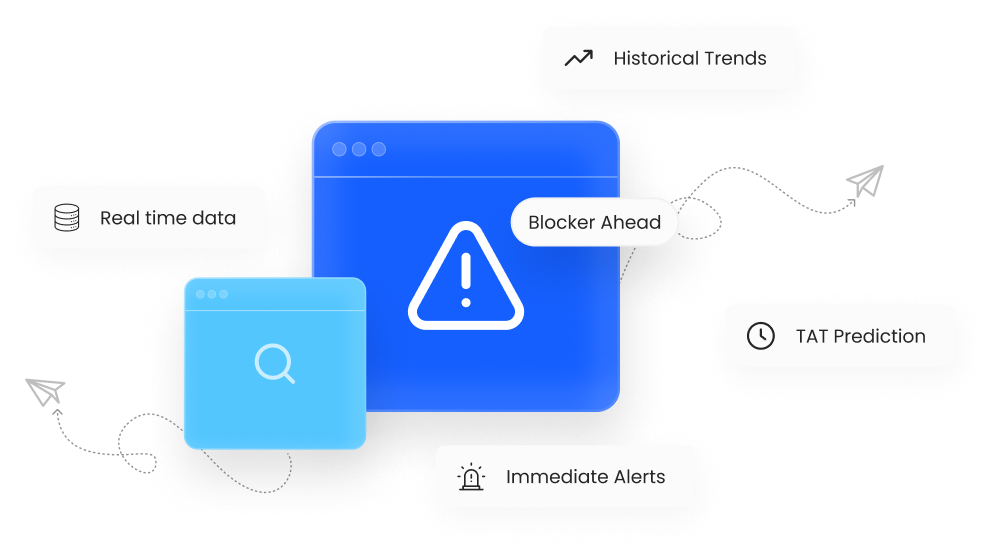
Predictive last mile TAT

Evaluates carriers on destination-level efficiency, not just origin and transit performance.
Predictive last mile TAT - Mobile
Icon - 4234

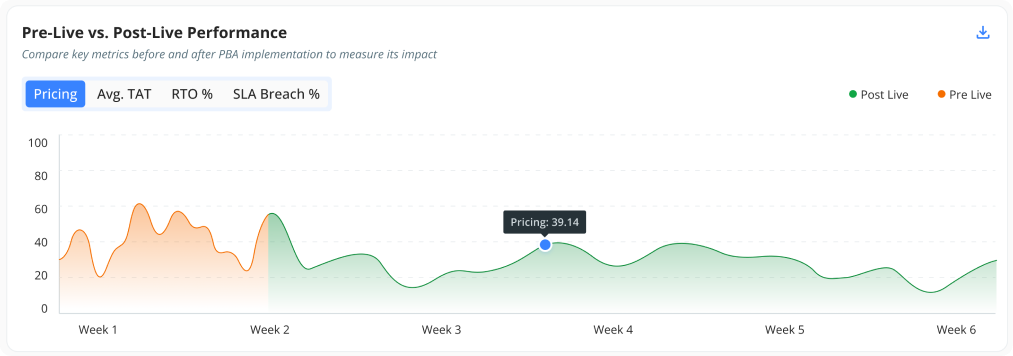
Simulate before you integrate

Test out different scenarios and adjust parameters to see how they impact your business metrics.
Simulate before you integrate - Mobile
Predictive last mile TAT - Desktop
Simulate before you integrate - Desktop

Leading carriers, shopfronts, WMS, ERP, OMS
Shopify - Fit
Increff - Fit
SAP
Vinculum - Fit
Shiphero - Fit
Woo Commerce - Fit
Dukaan - Fit
Magento - Fit
Capillary - Fit
UPS - Fit
Delhivery - Fit
Bluedart - Fit
4.8 Ratting Stars - White
4.4 Rating Stars White 4.4

Make Every
Shipment Count

Discover how the most loved brands grow with ClickPost
users-love-us G2 2026 JAN 1 Momentum Leader Jan 2026 1 Highest User Adoption Jan 2026 1 High Performer Mid Market G2 2026 JAN 1

Frequently asked questions

How does AI carrier allocation decide which courier gets each order?

We look at how each of your carriers has actually been performing at that order’s destination: how fast they deliver there, how often they hit SLA, how many orders come back, and what they charge. The best overall fit gets the order. Network averages hide a lot. A carrier can be excellent in metros and struggle in tier 3 towns, and our model draws on 200B+ shipment data points to catch that difference.

Will it always pick the cheapest courier?

No, and that’s deliberate. The cheapest option on a lane is often the one with the weakest last mile. A returned COD order costs you freight both ways, plus the sale. So we balance cost against delivery success. When two carriers perform about the same, the cheaper one wins. Brands using allocation see 22% lower shipping costs.

Can carrier allocation really reduce RTO?

Yes, because a lot of RTO starts with a carrier that simply doesn’t do well in a region. Missed first attempts, thin coverage and slow reattempts all add up. We track RTO by carrier and destination and route orders away from those weak spots. For orders that still fail, failed delivery management helps you recover them before they head back to your warehouse.

Will my orders reach customers faster?

In most cases, yes. We predict each carrier’s last mile turnaround for the destination, not just origin and transit time, and send the order to whoever is likely to get there first. Brands see 31% faster deliveries. If you also use delivery date estimates, the date you show at checkout matches what your carriers can actually do.

What happens when a carrier slows down during a sale?

It gets fewer orders on the lanes where it’s slipping. Allocation runs on recent data, so you don’t have to wait for a weekly report to spot the problem and then reshuffle volume by hand in the middle of a sale. There’s more on peak planning in our Festive Readiness Hub.

How do I compare courier performance without spreadsheets?

Our carrier performance insights pull this from your own shipments, broken down by carrier and region. No more stitching together reports from each carrier’s panel every month. It also helps when you sit down to renegotiate rates, because the numbers are already in front of you.

Will it work with the carriers and systems I already use?

Most likely. We integrate with 700+ carriers across 30+ countries, so allocation runs on the carrier contracts you already have. On the systems side, we connect with Shopify, Magento and WooCommerce, and with WMS and OMS platforms like Increff, Vinculum, SAP and Capillary. The full list is on our carrier integrations page.