In this blog
Python’s garbage collector handles most memory management automatically — until it doesn’t. In long-running production services, memory usage creeps up over hours or days, OOM kills start hitting your containers, and tracemalloc tells you “yeah, there are allocations” without giving you the full picture. We needed something better.
So we built a C-based memory profiler that intercepts allocations below the Python interpreter, uses sampling to keep overhead minimal, attributes every allocation back to the originating Python function, and ships the data to Elasticsearch in real-time. No code changes. No restarts. Just set an environment variable:
This post covers how we built it, the Linux dynamic linking tricks that make it possible, what we actually found in production, and why this approach catches leaks that pure-Python profilers miss.
The Problem: Python Memory Leaks Are Harder Than They Look
Python’s reference counting and cyclic garbage collector are great for typical application code. But in production services — think microservices processing millions of tracking updates per day — memory leaks happen for reasons invisible to Python-level tools:
-
C extension leaks: Libraries like lxml, numpy, or database drivers allocate memory through C’s malloc. Python’s tracemalloc can’t see these at all.
-
Reference cycles involving __del__: Objects with destructors can’t be collected by the cyclic GC, silently leaking.
-
Arena fragmentation: CPython’s memory allocator (pymalloc) uses arenas. Even when objects are freed, the arena may not be returned to the OS.
-
Hidden allocations in standard library code: Things like warnings.warn() or time.strftime() that allocate strings on every call — invisible unless you’re watching at the C level.
Why Not tracemalloc or Memray?
We evaluated every major option. Here’s the comparison that drove our decision:
| feature |
tracemalloc |
Memray |
Our Profiler |
|
Sees C malloc? |
No |
Yes (with --native) |
Yes |
|
Memory overhead |
200-400MB extra |
GB trace files |
~3-5% CPU |
|
Config changes? |
tracemalloc.start() |
PYTHONMALLOC=malloc |
Just LD_PRELOAD |
|
Real-time monitoring? |
No |
No (offline) |
Yes (Elasticsearch) |
|
Customizable? |
Limited |
No (black box) |
Fully |
|
Production-safe? |
Risky (OOM) |
attach can crash |
Yes |
|
Leak detection |
Python objects only |
Needs pymalloc off |
Retention sampling |
tracemalloc: High Memory Cost, Blind to C
It eats memory. tracemalloc stores a full Python traceback for every live allocation. We saw 200–400MB of overhead on services already tight on memory. You’re trying to diagnose an OOM, and the profiler makes it happen faster.
It can’t see C malloc. When lxml calls xmlMalloc, when your database driver allocates result buffers in C — tracemalloc sees none of it. In our services, ~30–40% of memory was allocated through C extensions.
It requires code changes. You need to call tracemalloc.start(nframes) and decide the frame depth upfront.
Memray: Not Built for Production Monitoring
Bloomberg’s Memray is impressive for debugging. But it needs PYTHONMALLOC=malloc for accurate leak detection (changing program behavior), generates gigabyte trace files, and memray attach can crash your process. There’s no way to stream data to Elasticsearch or set up Kibana dashboards.
Understanding Dynamic Linking: The Foundation
To understand why our profiler works, you need to understand how programs find their functions at runtime.
Static vs Dynamic: A Live Demo
Take a simple C program and compile it two ways:
The static binary is 70x larger because it has malloc baked in at a fixed address. The dynamic binary just says “I need malloc from somewhere.”
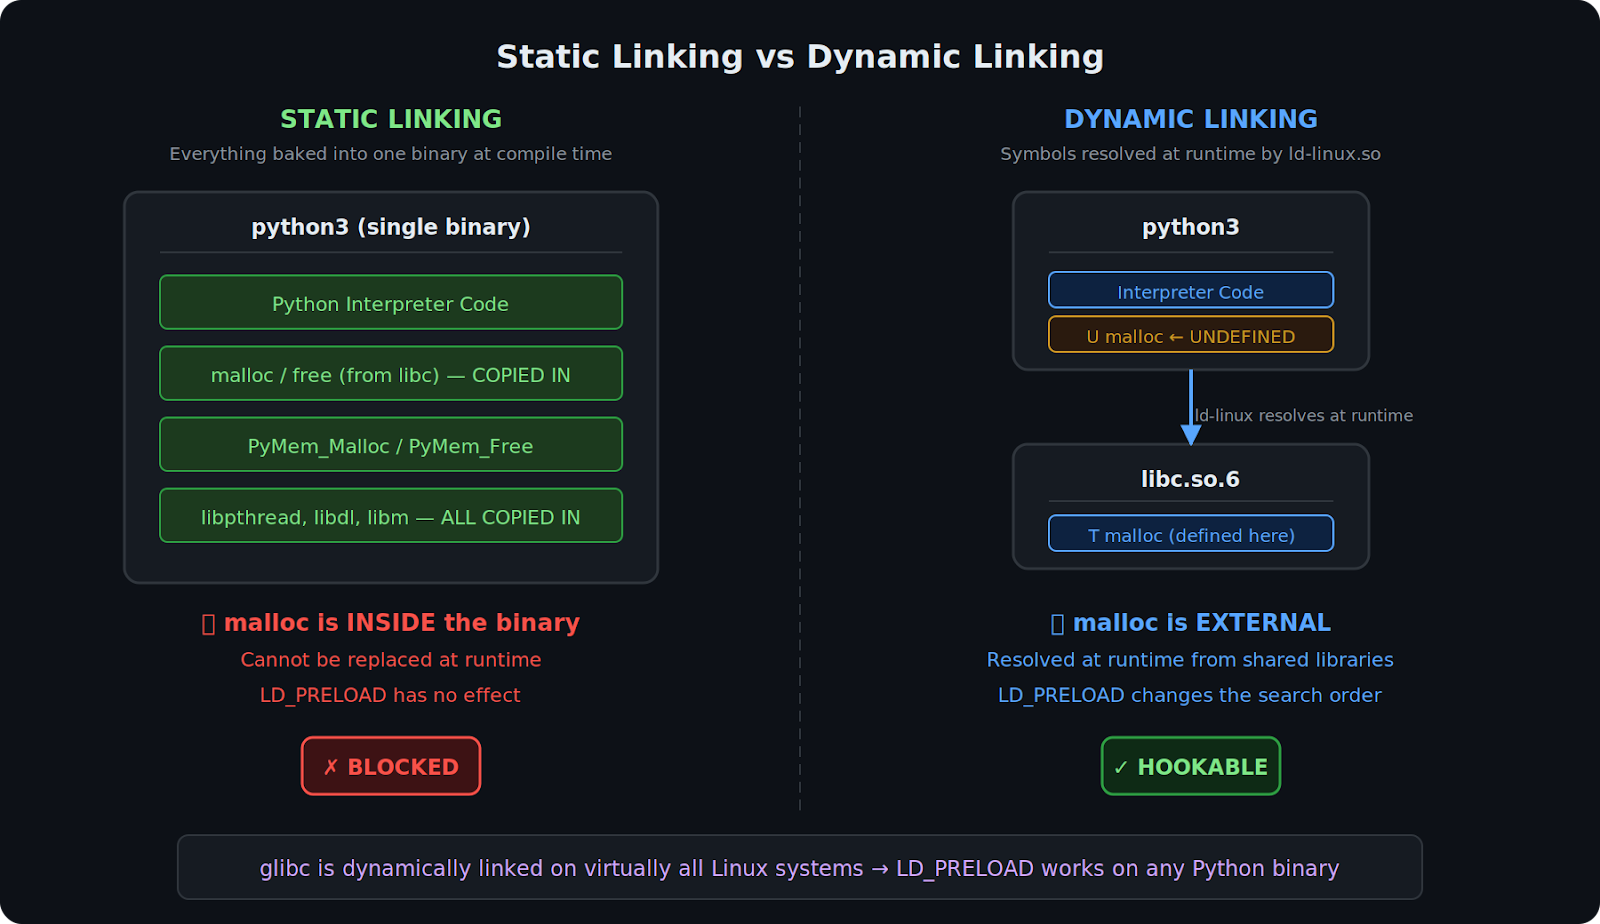
Static vs Dynamic Linking
How Python’s Memory Functions Are Linked
Where Python’s allocation functions live determines what we can intercept.
Reading Python’s Symbol Table
U (undefined) = always interceptable via LD_PRELOAD. T (defined) = depends on how the binary was built.
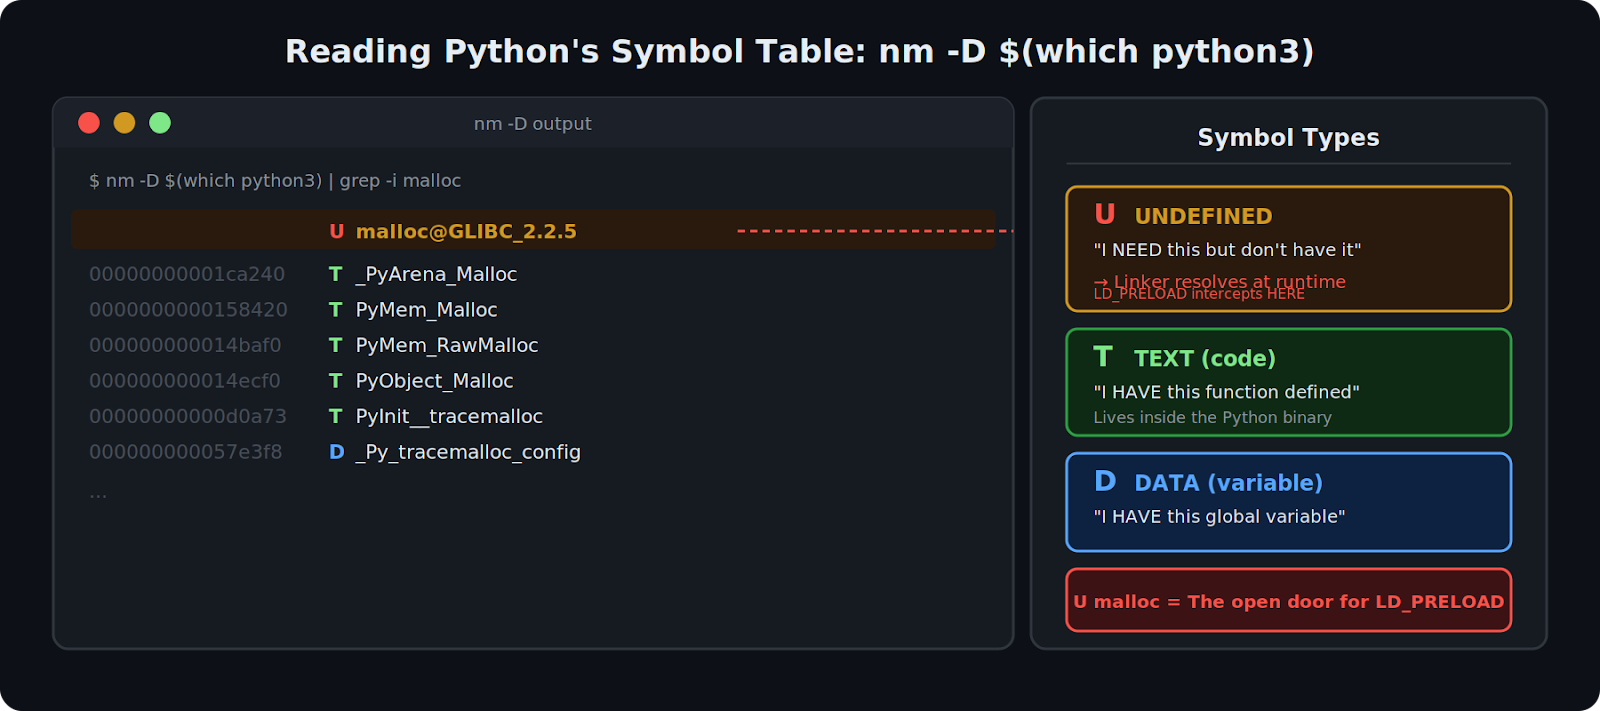
Reading Python’s Symbol Table
The Two Python Builds
Python can be built with libpython statically baked in (Debian/Ubuntu) or dynamically linked as a shared library (Fedora, custom builds). This changes interception behavior:
Build 1: Static libpython (Debian/Ubuntu aarch64)
Internal calls are hardcoded direct jumps — the dynamic linker is never involved.
Build 2: Dynamic libpython (custom build / Fedora)
All calls to PyMem_Malloc go through the PLT — LD_PRELOAD intercepts them.
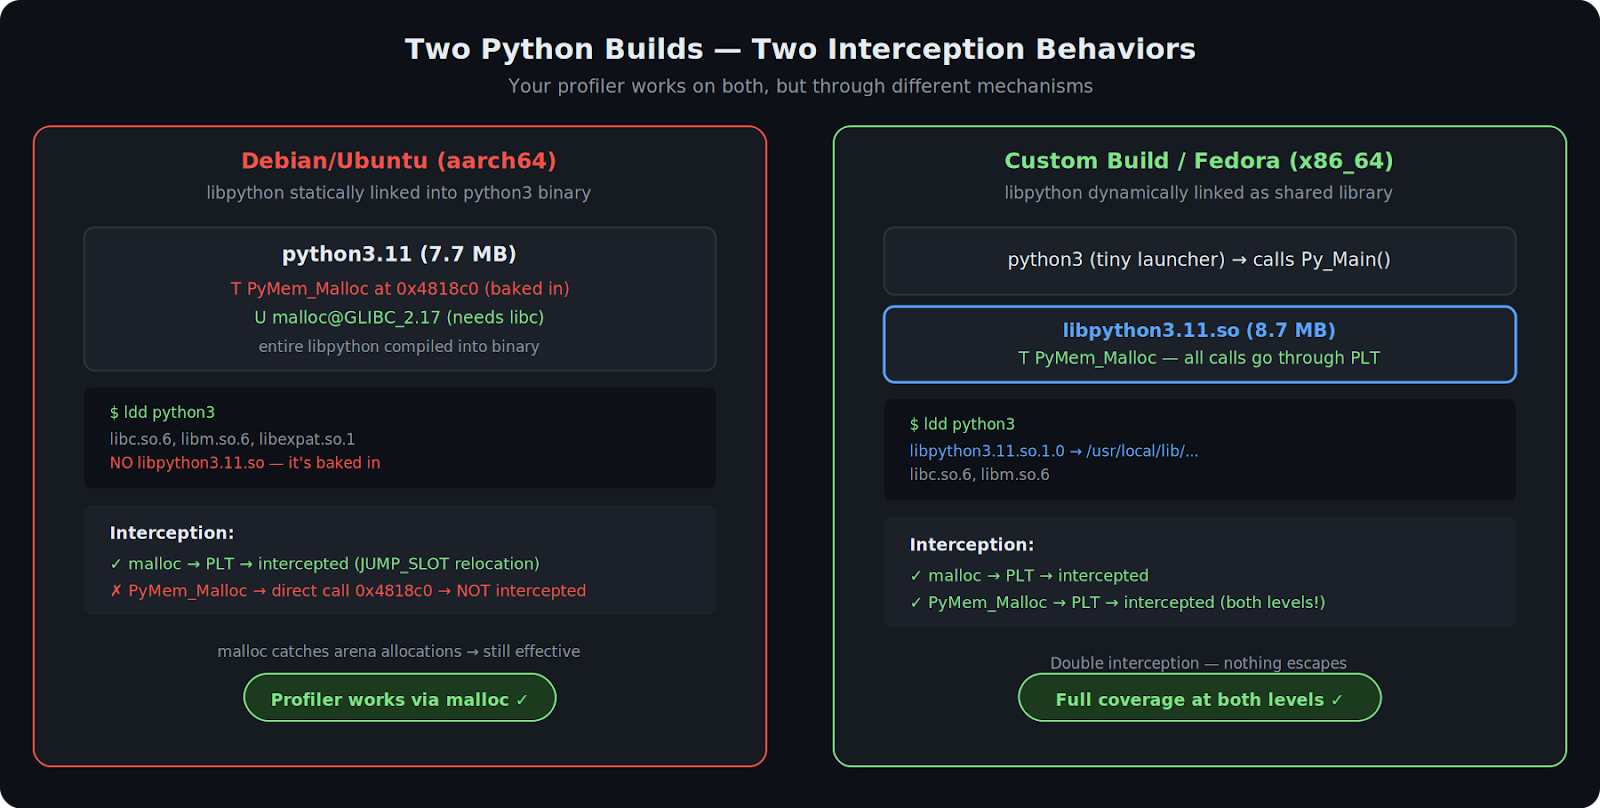
Two Python Builds — Two Interception Behaviors
Proving It with LD_DEBUG
Watch the dynamic linker resolve symbols with the profiler loaded:
Two lines — the complete chain:
-
libpython calls PyMem_Malloc → lands in trackleak.so (our profiler intercepts it)
-
trackleak.so calls the real one via dlsym(RTLD_NEXT) → lands in libpython (we pass it through)
Why the Profiler Works on Both Builds
The malloc symbol is U (undefined) on every build. It always goes through the PLT. Even when PyMem_Malloc is baked into the binary, it eventually calls malloc when it needs a new arena — and that call goes through the dynamic linker.
On static-libpython builds, you catch everything through the malloc safety net. On dynamic-libpython builds, you catch both levels. Either way, nothing escapes.
The Allocation Flow: Normal vs Intercepted
Normal flow:
With LD_PRELOAD=trackleak.so — double interception:
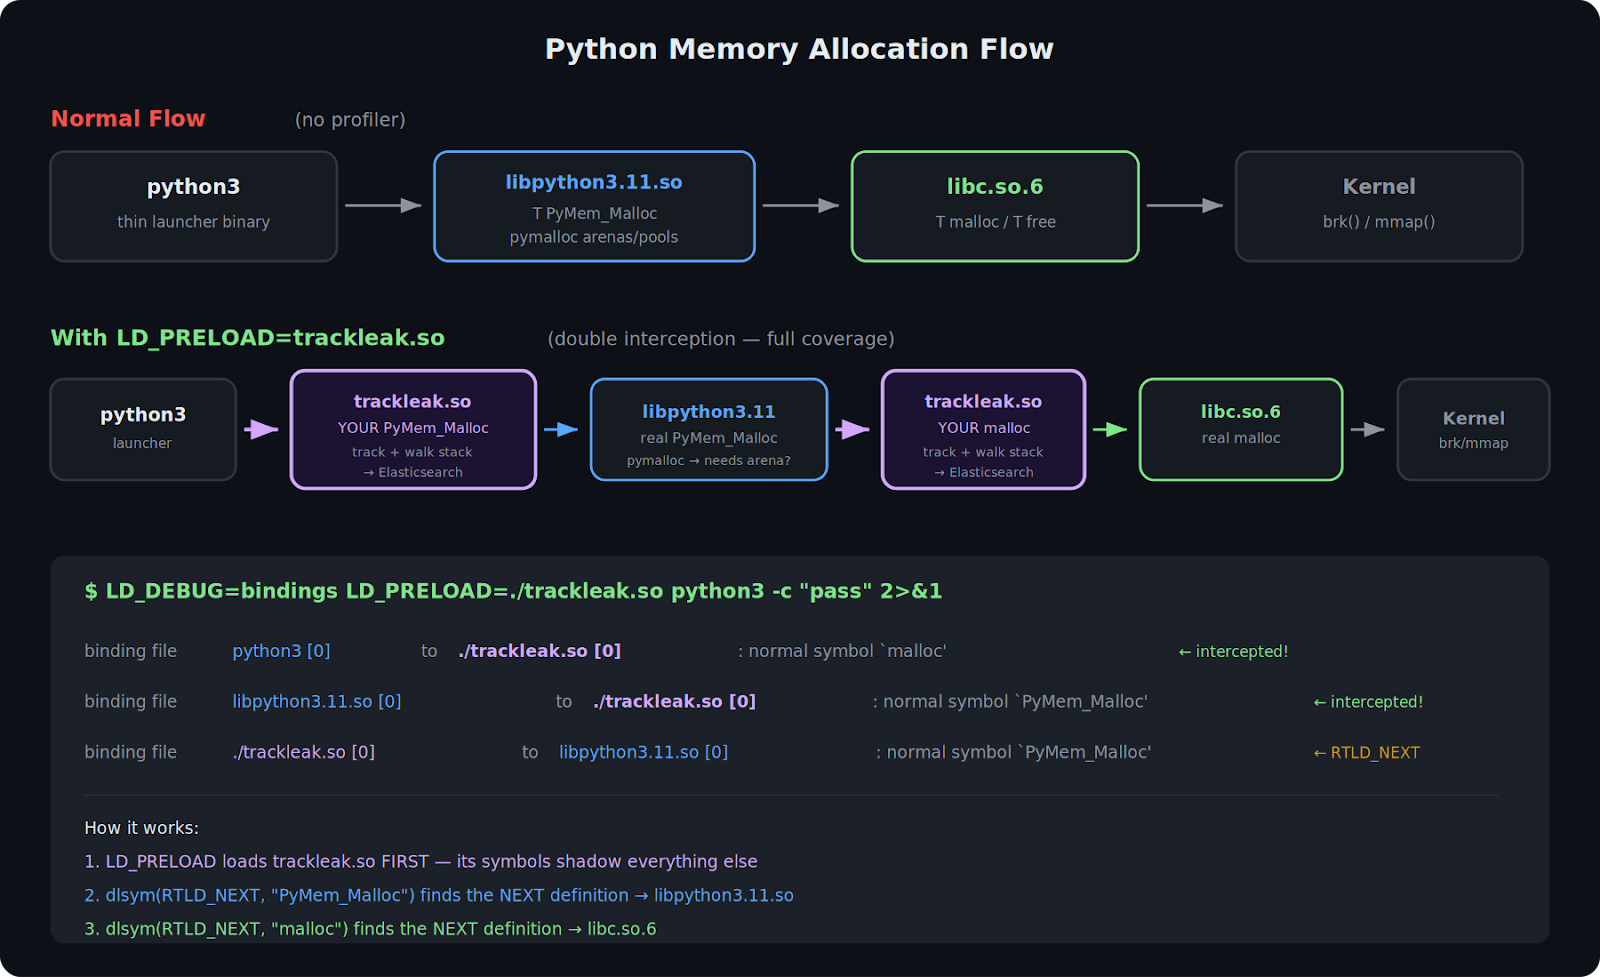
Python Memory Allocation Flow — Normal vs Intercepted
Symbol Interposition: How LD_PRELOAD Works
The dynamic linker resolves function symbols at runtime by searching shared libraries in order. LD_PRELOAD lets you jump the queue. dlsym(RTLD_NEXT, "malloc") means “skip me, find the next definition” — giving us a pointer to libc’s real malloc.
A Minimal Example
Every malloc call — from CPython’s interpreter loop, from NumPy’s array allocations, from OpenSSL inside your HTTP client — now prints to stderr. No recompilation, no code changes.
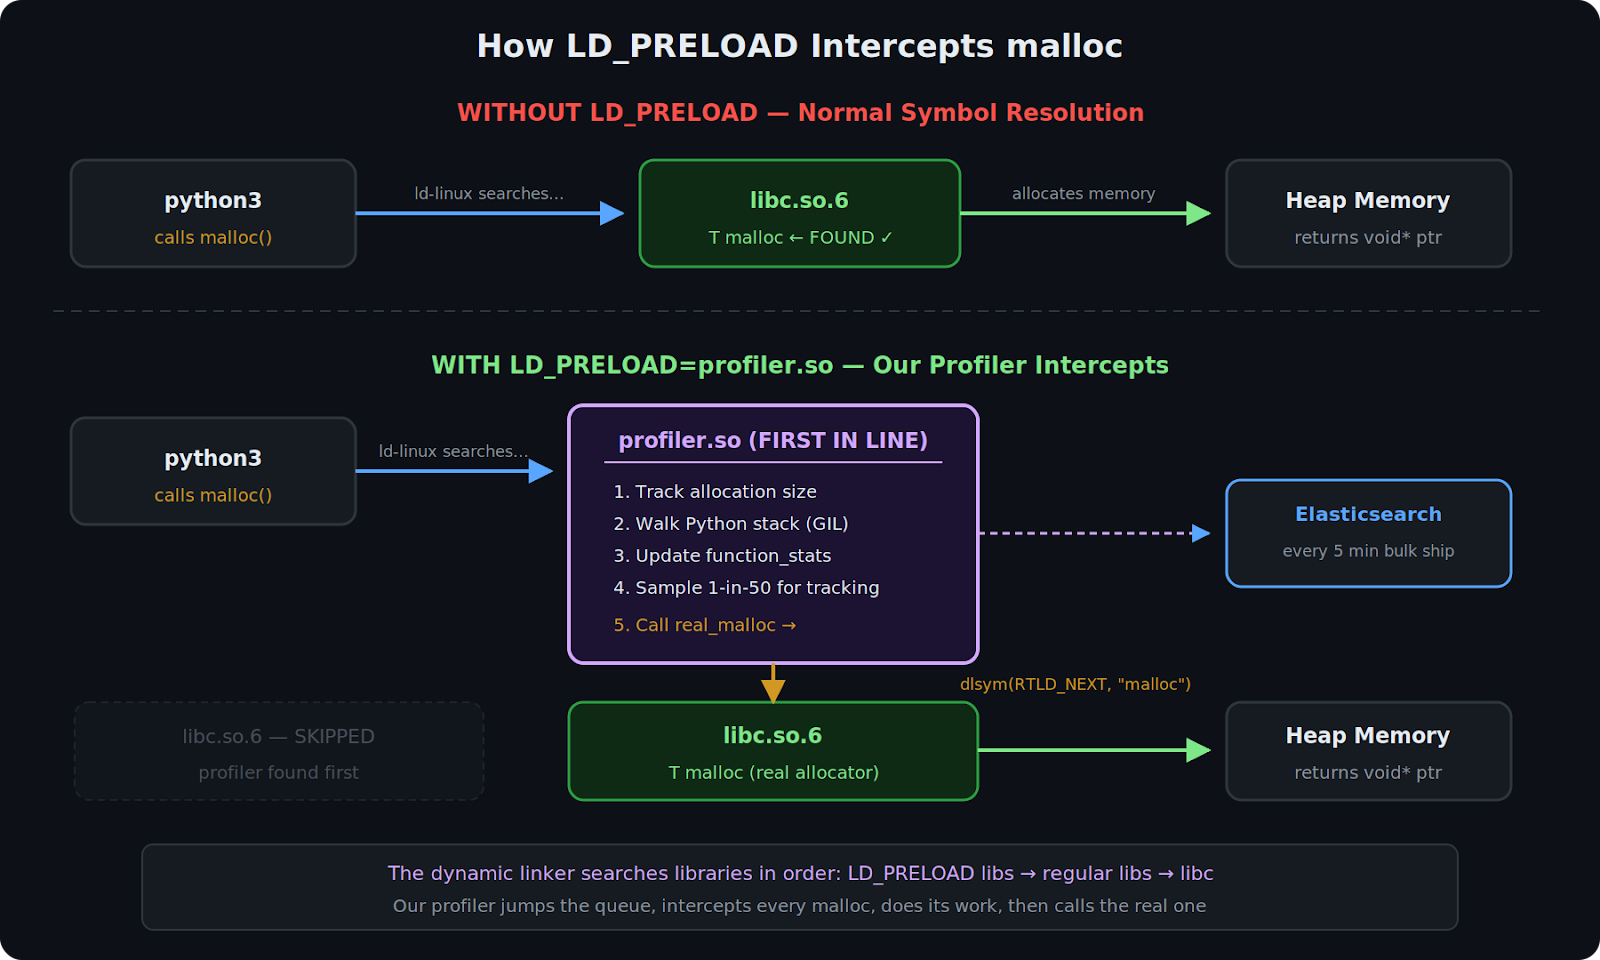
How LD_PRELOAD Intercepts malloc
Architecture of the Profiler
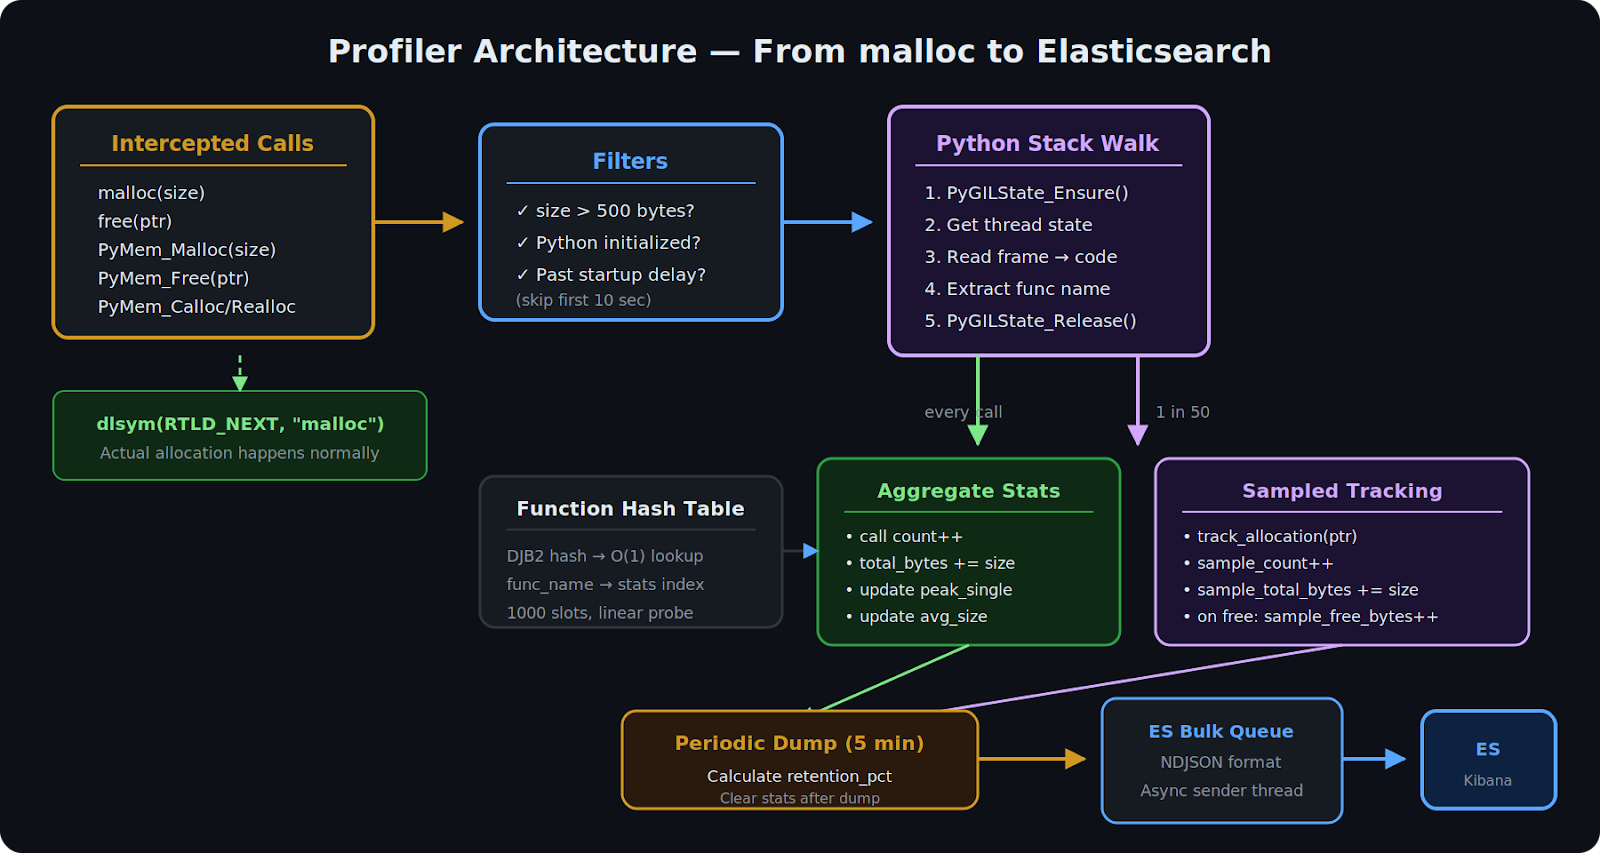
Profiler Architecture — From malloc to Elasticsearch
Functions We Intercept
We intercept six functions total:
On dynamic-libpython builds, all six are intercepted. On static-libpython builds, malloc/free are always intercepted, and PyMem_* are intercepted only from C extensions.
Avoiding Infinite Recursion
Our profiler uses functions that call malloc. We use a thread-local guard (__thread int in_malloc) to detect re-entry:
Walking the Python Stack from C
From inside our C malloc wrapper, we acquire the GIL, walk the frame chain, extract function name / file path / line number, then release the GIL:
Why the GIL is necessary: This isn’t about protecting your globals — it’s about protecting CPython’s internal heap objects. PyUnicode_AsUTF8() may write to the object (lazy UTF-8 cache creation). PyFrame_GetCode() does Py_INCREF (a refcount write). Frames can be freed by other threads at any moment. Without the GIL: corrupted refcounts, dangling pointers, segfaults.
Leak Detection Through Retention Rate
The key metric:
On malloc: sample 1-in-50 and track the pointer in a hash table.
On free: look up the pointer — if it was sampled, credit the freed bytes to the originating function.
High retention = memory leak candidate. A function with 95% retention is allocating memory that nobody is freeing.
The pymalloc Blind Spot
CPython doesn’t call malloc for every small object. It grabs 256KB arenas and carves them internally. We filter for allocations above 500 bytes — the leaks that matter (large buffers, HTTP bodies, deserialized data) bypass pymalloc and hit malloc directly.
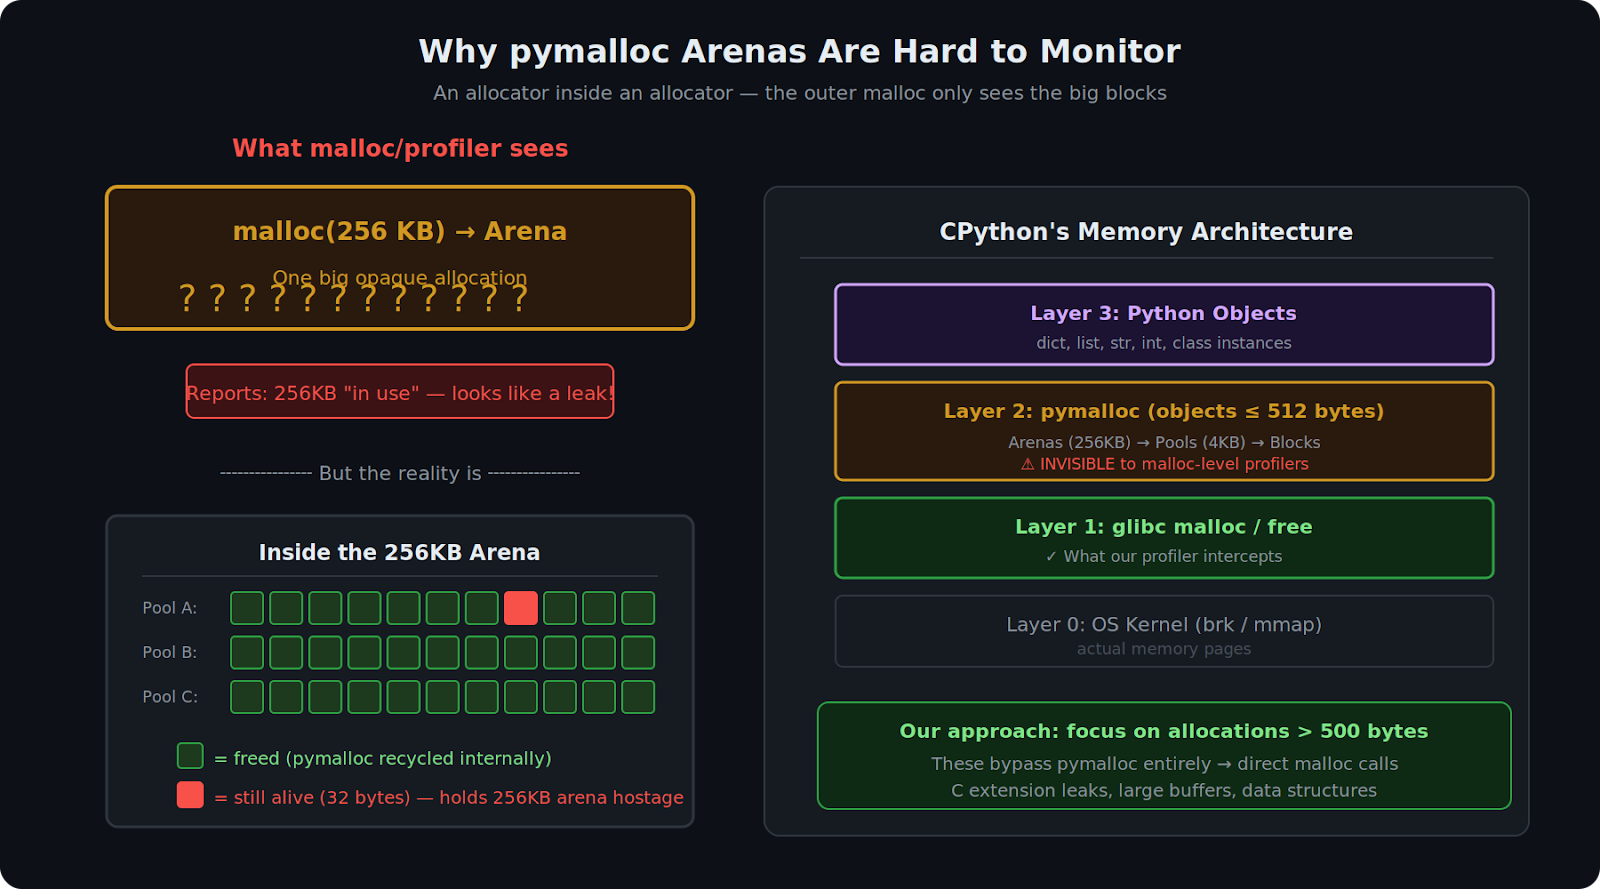
Why pymalloc Arenas Are Opaque to malloc-level Profilers
What We Found in Production
On our tracking and shipment update services — high-throughput consumers processing millions of messages — we found two memory leaks hiding in plain sight.
Bug #1: Django’s warnings.warn() on Every Database Write
Every database write with a naive datetime triggered warnings.warn(). Under the hood, that builds formatted strings, creates WarningMessage objects, and walks the entire call stack. Dozens of string allocations per call, thousands of times per second.
Fix: Comment out the warning. We know our datetimes are naive — no need for Python to warn us on every single database write.
Bug #2: Python’s Logging formatTime on Every Log Line
Two string allocations per log line via time.strftime(). Millions of string objects per hour on a heavily-logging shipment tracking service.
Fix: Return the epoch timestamp as a string and parse it in the ELK pipeline instead. One tiny allocation instead of two formatted strings.
How We Found These
Both bugs share a pattern: death by a thousand cuts. Each individual allocation is tiny. No single call leaks memory. But at thousands of calls per second, allocations accumulate faster than the garbage collector can clean them up.
The profiler’s Kibana dashboards showed these functions with high allocation volume and elevated retention rates. Neither would have been caught by code review, tracemalloc, or Memray trace analysis.
Deployment
One environment variable:
Auto-detects NOMAD_JOB_NAME for tagging. 10-second startup delay to skip noisy initialization. Ships to Elasticsearch every 5 minutes via async bulk API. ~3–5% CPU overhead. Kibana dashboards show top allocators, retention trends, and per-service memory profiles.
Lessons Learned
-
Sampling is non-negotiable. Our early prototype tracked every allocation. It worked in testing and fell over under 10K req/s. 1-in-50 gives valid retention rates at <5% overhead.
-
Hash table resets beat resizes. When the table fills up, wipe it clean. A crash in the profiler is worse than losing data.
-
GIL acquisition from C is tricky. Calling PyGILState_Ensure() from inside a malloc wrapper that might be called from any thread requires a recursion guard.
-
Know your Python build. Whether PyMem_Malloc is interceptable depends on static vs dynamic libpython. Use ldd $(which python3) to check. Either way, malloc interception is your safety net.
Wrapping Up
The code is straightforward C — LD_PRELOAD, dlsym, and the Python C API. One .so file, one environment variable. The bugs it found — warnings.warn() firing on every DB write, time.strftime() allocating on every log line — were invisible to every other tool we tried.
Sometimes the leak isn’t in your code. It’s in the code your code calls, at a layer below where Python can see.
🔗 TrackLeak is open source!
Get the code, file issues, and contribute: