In this blog
A thread is a fundamental unit of execution within a program, representing a single, sequential flow of instructions

The Problem with Existing APM Solutions
The market offers numerous Application Performance Monitoring (APM) tools for API server monitoring. While these solutions excel at showing basic metrics like API performance, memory usage, and CPU utilization, they fall short in providing crucial insights into what's happening under the hood.
The Critical Gap: Traditional APMs don't reveal what threads are actually doing or where they're getting stuck. This lack of deep visibility turns scaling into a costly guessing game.
Our Experience: The Hidden Cost of Blind Scaling
We encountered this problem firsthand when our Python threads became stuck in GIL (Global Interpreter Lock) contention. Our APM dashboard showed high resource usage, but couldn't tell us why. Without understanding the root cause, we made the classic mistake:
- Increased thread counts
- Added more machines
- Scaled infrastructure blindly
The result? Significantly higher infrastructure costs with minimal performance improvement. Especially when scaling inefficient cloud servers without visibility into the actual bottlenecks.
The Clickpost Approach: Data-Driven Performance Optimization
At Clickpost, we believe in going beyond surface-level monitoring. Our goal is to:
- Identify root causes of latency issues
- Make data‑backed decisions for scaling
- Optimize performance based on actual bottlenecks, not assumptions
- Leverage MySQL ETL tools to streamline data pipelines for reporting
What This Article Covers?
This article explains how we developed our in-house thread profiling system that provides deep application insights without impacting performance. You'll learn how we moved from reactive scaling to proactive optimization through better visibility into our application's behavior.
The Problem: Guessing Games with Server Performance
Like many development teams, we've been scaling our systems for years. But when it came to managing threads in our Python and Java servers, we were essentially playing a guessing game.
Traditional approaches focused on monitoring fundamental system resources: CPU usage, memory consumption, disk space, and network bandwidth. Tools like top, htop, vmstat, and iostat provided insights into server performance, with administrators setting up alerts when thresholds were exceeded.
But this approach had serious problems:
The CPU wasn't our only bottleneck. We discovered several hidden performance killers:
- Lock contention: Threads waiting for each other to release locks
- I/O wait times: Threads sitting idle while waiting for disk or network operations
- Python's GIL problem: In Python, the Global Interpreter Lock (GIL) means more threads can actually make things slower
- Memory overhead: Each thread consumes memory, and Linux stores thread information in structures that add up quickly
- Infrastructure costs: More threads = more memory = higher cloud bills
The catch? We needed answers without modifying our application code or impacting performance.
The Solution: Enter eBPF
After exploring various options, we discovered eBPF (Extended Berkeley Packet Filter) - a powerful Linux technology that lets us peek inside our system's kernel without breaking anything.
What is eBPF?
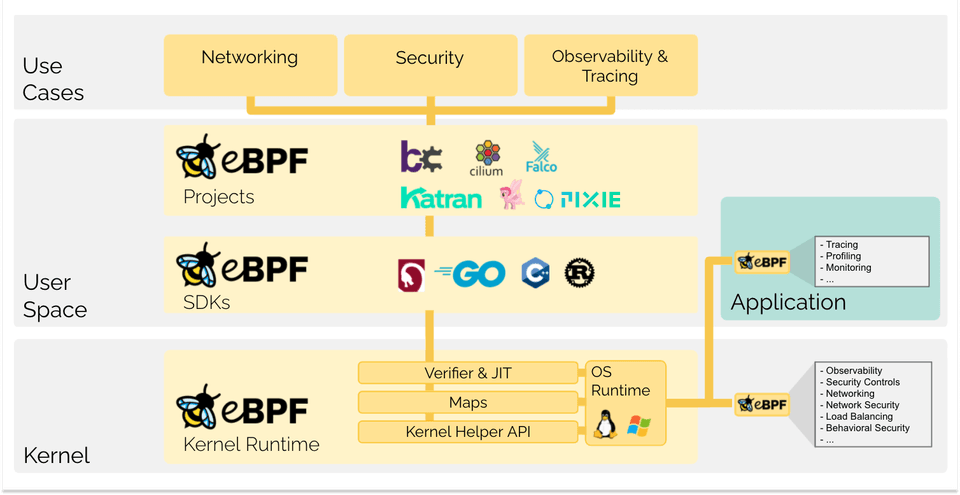
Image source
Think of eBPF as a way to insert tiny "spies" into your operating system. These spies can watch what's happening and report back without slowing things down.
Originally designed for monitoring network packets, eBPF has evolved into a Swiss Army knife for system monitoring. It lets you:
- Attach "hooks" to kernel functions (the core of your operating system)
- Monitor system calls (requests your program makes to the OS)
- Track user-space functions (functions in your application)
- Collect detailed performance data with minimal overhead

Real-world analogy: Imagine being able to place invisible cameras at every door in a busy office building to see who goes where, how long they spend in each room, and where bottlenecks occur - all without anyone knowing the cameras are there.
Our Investigation Process
Before we could build our solution, we needed to understand exactly how our servers handle requests. We used Linux's `strace` command to spy on our Python and Java server system calls.
What We Discovered: The Life of a Web Request
Every web request follows a predictable pattern at the system level:
- Accept: The server accepts a new connection using the `accept` system call
- Read: A thread reads the request data using the `read` system call
- Process: The application processes the request (this is where your business logic runs)
- Write: The thread sends the response back using the `write` system call
- Close: The connection is closed using the `shutdown` system call

The names of a system call can vary depending on your system.
Key insight: Each connection gets a unique identifier called a "file descriptor" (fd). This became the foundation of our monitoring system.
Additional Complexity
Real servers are more complex than this simple flow. Python servers also use:
- - `epoll_ctl` for managing multiple connections efficiently
- - `ioctl` for various I/O operations
But we kept our focus on the core pattern to avoid overcomplicating our solution.
Building Our eBPF Solution
The Monitoring Strategy
We identified the key functions to monitor:
1. For thread synchronization:
- `pthread_mutex_lock` (from glibc library) - to measure lock contention
2. For I/O wait tracking:
- `finish_task_switch` (kernel function) - called during context switches when threads wait for I/O
3. For request tracking:
- - `accept`, `read`, `write`, `shutdown` system calls - to track the request lifecycle
What We Measure?
Our eBPF programs calculate six critical metrics:
1. Request Latency - How long each request takes from start to finish?
How it works: When a connection is accepted (accept system call) , we store its file descriptor and timestamp. When the connection is closed (shutdown system call), we calculate the difference.

2. Number of Queued Requests - How many requests are waiting for available threads?
How it works: We track file descriptors that have been accepted but haven't been read by ‘read’ system call yet. These represent requests waiting in the queue.

3. Thread Utilization - What percentage of our threads are actually doing work?
How it works: Every time a thread reads (read system call) a request, we record its ID. Every 10 seconds, we analyze which threads were active.
 4. Lock Latency - How much time threads spend waiting for locks.
How it works: We measure the time between entering and exiting `pthread_mutex_lock` functions.

5. I/O Wait Per Thread - How much time threads spend waiting for disk or network operations.
How it works: We measure time spent in context switches using the `finish_task_switch` function.

6. Total Request Count - Overall request volume for capacity planning.
The Technical Implementation
The Foundation: File Descriptors
In Linux, "everything is a file" - including network connections. Each connection gets a unique file descriptor (fd) within a process. This fd becomes our tracking key.
Smart Data Collection
eBPF provides built-in functions that make monitoring easier:
- Get process ID and thread ID of currently executing functions
- Access system call parameters and return values
- Store data in efficient hash maps and arrays
- Perform calculations with minimal performance impact
The Results: What We Learned
Immediate Benefits
Our eBPF-based monitoring revealed several eye-opening insights:
- CPU usage was misleading: Threads with low CPU usage were often blocked waiting for locks or I/O
- Queue depth mattered more than we thought: Understanding request queuing helped us optimize thread pool sizing
- Lock contention was our hidden enemy: Some threads spent 40% of their time waiting for locks
- I/O patterns were unpredictable: Network and disk wait times varied dramatically throughout the day
Optimization Wins
Armed with real data, we made targeted improvements:
- Right-sized thread pools based on actual utilization, not guesswork
- Identified and fixed lock contention in critical code paths
- Optimized I/O patterns to reduce wait times
- Implemented smarter load balancing based on queue depth
Performance Improvements
- 35% reduction in average response time
- 50% fewer requests stuck in queues during peak traffic
- 20% reduction in infrastructure costs due to better resource utilization
- Eliminated the guesswork from scaling decisions
Why This Approach Works?
Non-Intrusive Monitoring - Unlike application-level profiling tools, eBPF monitoring doesn't require code changes or performance trade-offs.
Kernel-Level Accuracy - By monitoring at the kernel level, we see exactly what the operating system sees - no sampling or estimation.
Language Agnostic - Our solution works for Python, Java, Go, or any language that uses standard system calls.
Production Safe - eBPF programs are verified by the kernel before execution, preventing crashes or security issues.
Open Source Contribution - GitHub: https://github.com/clickpost-ai/thread_profiling/tree/main