.png?width=193&height=27&name=ClickPost%20Logo%20(Blue).png)
.svg)
.svg)
.svg)
.svg)
.svg)
.svg)
.svg)
.svg)
.svg)


.svg)

.svg)
.svg)
.svg)
.svg)
.svg)


.svg)
.svg)
.webp?width=286&height=206&name=ROI%20Calculator%20(1).webp)
.svg)
.svg)

.svg)

.webp?width=286&height=206&name=RTO%20Playbook%20(1).webp)



In this blog
TL/DR Summary
ClickPost's EDD module generates delivery date predictions across 50 million monthly shipments by combining machine learning, courier-declared signals, and client-uploaded SLAs into a configurable waterfall architecture.
-
Processing 600+ carrier integrations gives ClickPost's ML model breadth across Tier-3 pincodes and low-volume lanes where narrow datasets produce miscalibration.
-
The model trains on in-flight shipments rather than historical delivered data, because lagging indicators miss network degradation by up to two weeks.
-
A default 90% adherence target balances promise reliability against conversion impact, with over-padding beyond 95% resulting in customer-facing dates that exceed actual delivery times.
-
One D2C brand achieved a 20-point accuracy gain (55% to 75%) against only a 3-point adherence dip after adopting ClickPost ML EDD.
-
EDD min and EDD max expose prediction uncertainty as a range, calibrated to hold greater than 80% accuracy across the delivery window.
At ClickPost, we process over 50 million shipments a month across 600+ carrier integrations.
Somewhere in the lifecycle of each of those shipments, a number gets shown to a customer: the date their order will arrive. That number appears at the product page to influence the purchase decision, at checkout during payment, and on the tracking page once the shipment is in motion.
It is the same number, but it has to do different jobs at each of those points, and it has to survive contact with a network that is not actually fully predictable.
We spent a long time thinking about how to produce that number well. This post is about what we learned, the architecture we settled on, and the engineering decisions that create predictability through logic we can tune and control.
About ClickPost's EDD Module
ClickPost's EDD powers pre-order and post-order delivery promises for our clients. It combines a machine learning model trained on the platform's full shipment corpus alongside simpler options like courier-declared and brand-uploaded SLA signals. A breach detection layer proactively catches shipments likely to miss their promised date. The adherence target is configurable by the client, and revised EDDs are pushed to customers via notifications and populated on the tracking page.
What We Had to Figure Out Early On
Before we could build anything, we had to get clear on the engineering scope.
We observed repeated patterns of SLA variability and delivery lapses across our network. To find the breaking points, we had to probe deeper.
How does each existing system calibrate the delivery date, and where does each one start to fail?
How would a predictive model need to be measured, given that the date has to be both accurate (close to the real delivery day) and reliably met (rarely missed)?
And the question worth the most effort: how do we catch the shipments likely to miss the date before the breach occurs?
The answers touch model design, data architecture, and the way the prediction is served back into the tracking flow. Most of the work is in getting the composition right.
The System We Had Before ClickPost ML
Before we built the ML model, our EDD infrastructure supported two sources of delivery-date information. Our users could subscribe to either and configure which source was surfaced in their flow.
Courier-Declared EDD
Carriers send us expected delivery dates over tracking webhooks as the shipment moves through their network. This signal comes from the party actually moving the package, and it updates as the shipment progresses. It is only available once the shipment is in motion, which means it cannot be used at the product page or checkout.
Uploaded SLA
Many users maintain their own pincode-level delivery commitments, negotiated with their carriers and loaded into their operations systems. An uploaded SLA is a contractual artifact designed to be defensible, which means it carries a buffer to absorb bad days. For a client who has done the work of mapping out their network, it encodes knowledge about their specific pickup locations and volume patterns that a generic lookup would not have.
What We Were Observing
These two sources were the precursors to a system that worked as decoupled entities. They were not attuned to the realities we were seeing in carrier performance and lane-level data, which was leading to escalations.
The uploaded SLA was accurate for the lanes a client had mapped well, and less accurate for the tail of lanes they shipped on occasionally. Neither source could adapt to the current state of the carrier network. A lane running slow this week looked the same as one running on time, right up until the shipments started missing the date.
We decided to address this.
Why EDD Requires Prediction
The signals we already had were lookup-based. They answered the question "what date have we committed to, or been told by the carrier" but not "what date is this shipment actually going to arrive on."
To answer the second question, we needed a model.
The Problem Shape
The problem is to estimate how many days a shipment will take to deliver, given the shipment's features and the network state at the moment of prediction. The output is a number on a continuous scale, which matters because we need to distinguish between, for example, 2.6 days and 3.1 days. Both round to "about three days," but the buffer we add on top of the prediction to hit an adherence target depends on that precision. A tighter prediction lets us show a more aggressive date. A looser one forces more padding.
What Goes Into the Model
The features that matter fall into a handful of categories:
- Lane (origin pincode to destination pincode): The strongest single signal. Physical distance and carrier network topology dominate the transit time.
- Carrier and service type: Different carriers perform differently on the same lane, and express services move on different pathways than surface.
- Temporal features: Shipments booked at different times of day, on different days of the week, and in different weeks of the year experience different network conditions.
- Seasonal signals: Sale events and festivals change carrier network behavior in ways that a quarterly average cannot surface.
- Current network state: A lane performing normally this morning may be congested by the afternoon.
Why We Train on In-Flight Shipments
The most important design decision was what data to train on. The intuitive approach is to train on historical delivered shipments: look at every shipment that finished in the last 70 days, compute the actual delivery time, and fit a model to it. This works, but it lags the network. A lane that started underperforming two weeks ago only shows up in the training data once those shipments finish, and by that point, the model has been operating on an out-of-date view of the network for half a month.
The alternative, which we use, is to continuously retrain against in-flight shipments. We have tracking visibility into the shipments currently moving through each lane, and their progress (scans, dwell times, milestone timings) is a leading indicator of how shipments entering that lane right now will behave. Our carrier allocation algorithm also carries a recency bias, prioritizing the most recent performance signals, which keeps the model responsive to the network as it is today rather than as it was last quarter.
For logistics and eCommerce companies looking to build similar real-time ML prediction systems, using AI recruiting software to identify and hire AI/ML engineers experienced in machine learning infrastructure, continuous retraining pipelines, and production ML systems can help reduce recruitment delays and keep predictive models accurate and responsive to network changes.
What We Choose to Train the Model On
An enterprise shipping 100,000 orders a month observes only a narrow segment of a carrier's national network. A model built exclusively on that footprint will achieve confidence in high-volume lanes but remain miscalibrated across the rest of the map.
The ClickPost ML model is trained on the full platform corpus: 50 million+ monthly shipments across 600+ carrier integrations. This breadth is not for the high-volume lanes where most logic performs well; it is for the long tail. It covers the Tier-3 pincode, seeing two shipments a month, the newly integrated carrier, and the lane whose performance shifted this week. Where a narrow dataset produces overprecision, a broad one holds calibration.
Combination EDD: Composing the Signals
Once the ML model existed alongside the courier-declared EDD and the uploaded SLA, we had three distinct signals, each useful in a different situation. We needed a way to let our users compose them.
-png.png?width=3200&height=1472&name=Frame%20(1)-png.png)
Combination EDD serves as that composition layer, functioning as a waterfall across available sources. The system evaluates each source according to the priority sequence configured by the client, returning the first valid value it encounters. This allows for a modular approach: a customer may prioritize their uploaded SLA for high-confidence pincodes, fall back to ClickPost ML EDD for the remainder of their footprint.
Combination EDD operates as an opt-in architecture. Users designate which specific sources to include within their waterfall and determine the priority sequence themselves. Our engineering focus was on building the infrastructure for this composition; the logic of what to compose remains an operational decision for the user.
Adherence and Accuracy: Our Tuning Metrics
A model that produces predictions is only useful if we can measure whether the predictions are working. We ended up needing two metrics because each of them captures something the other cannot.
Keeping the Promise with Adherence
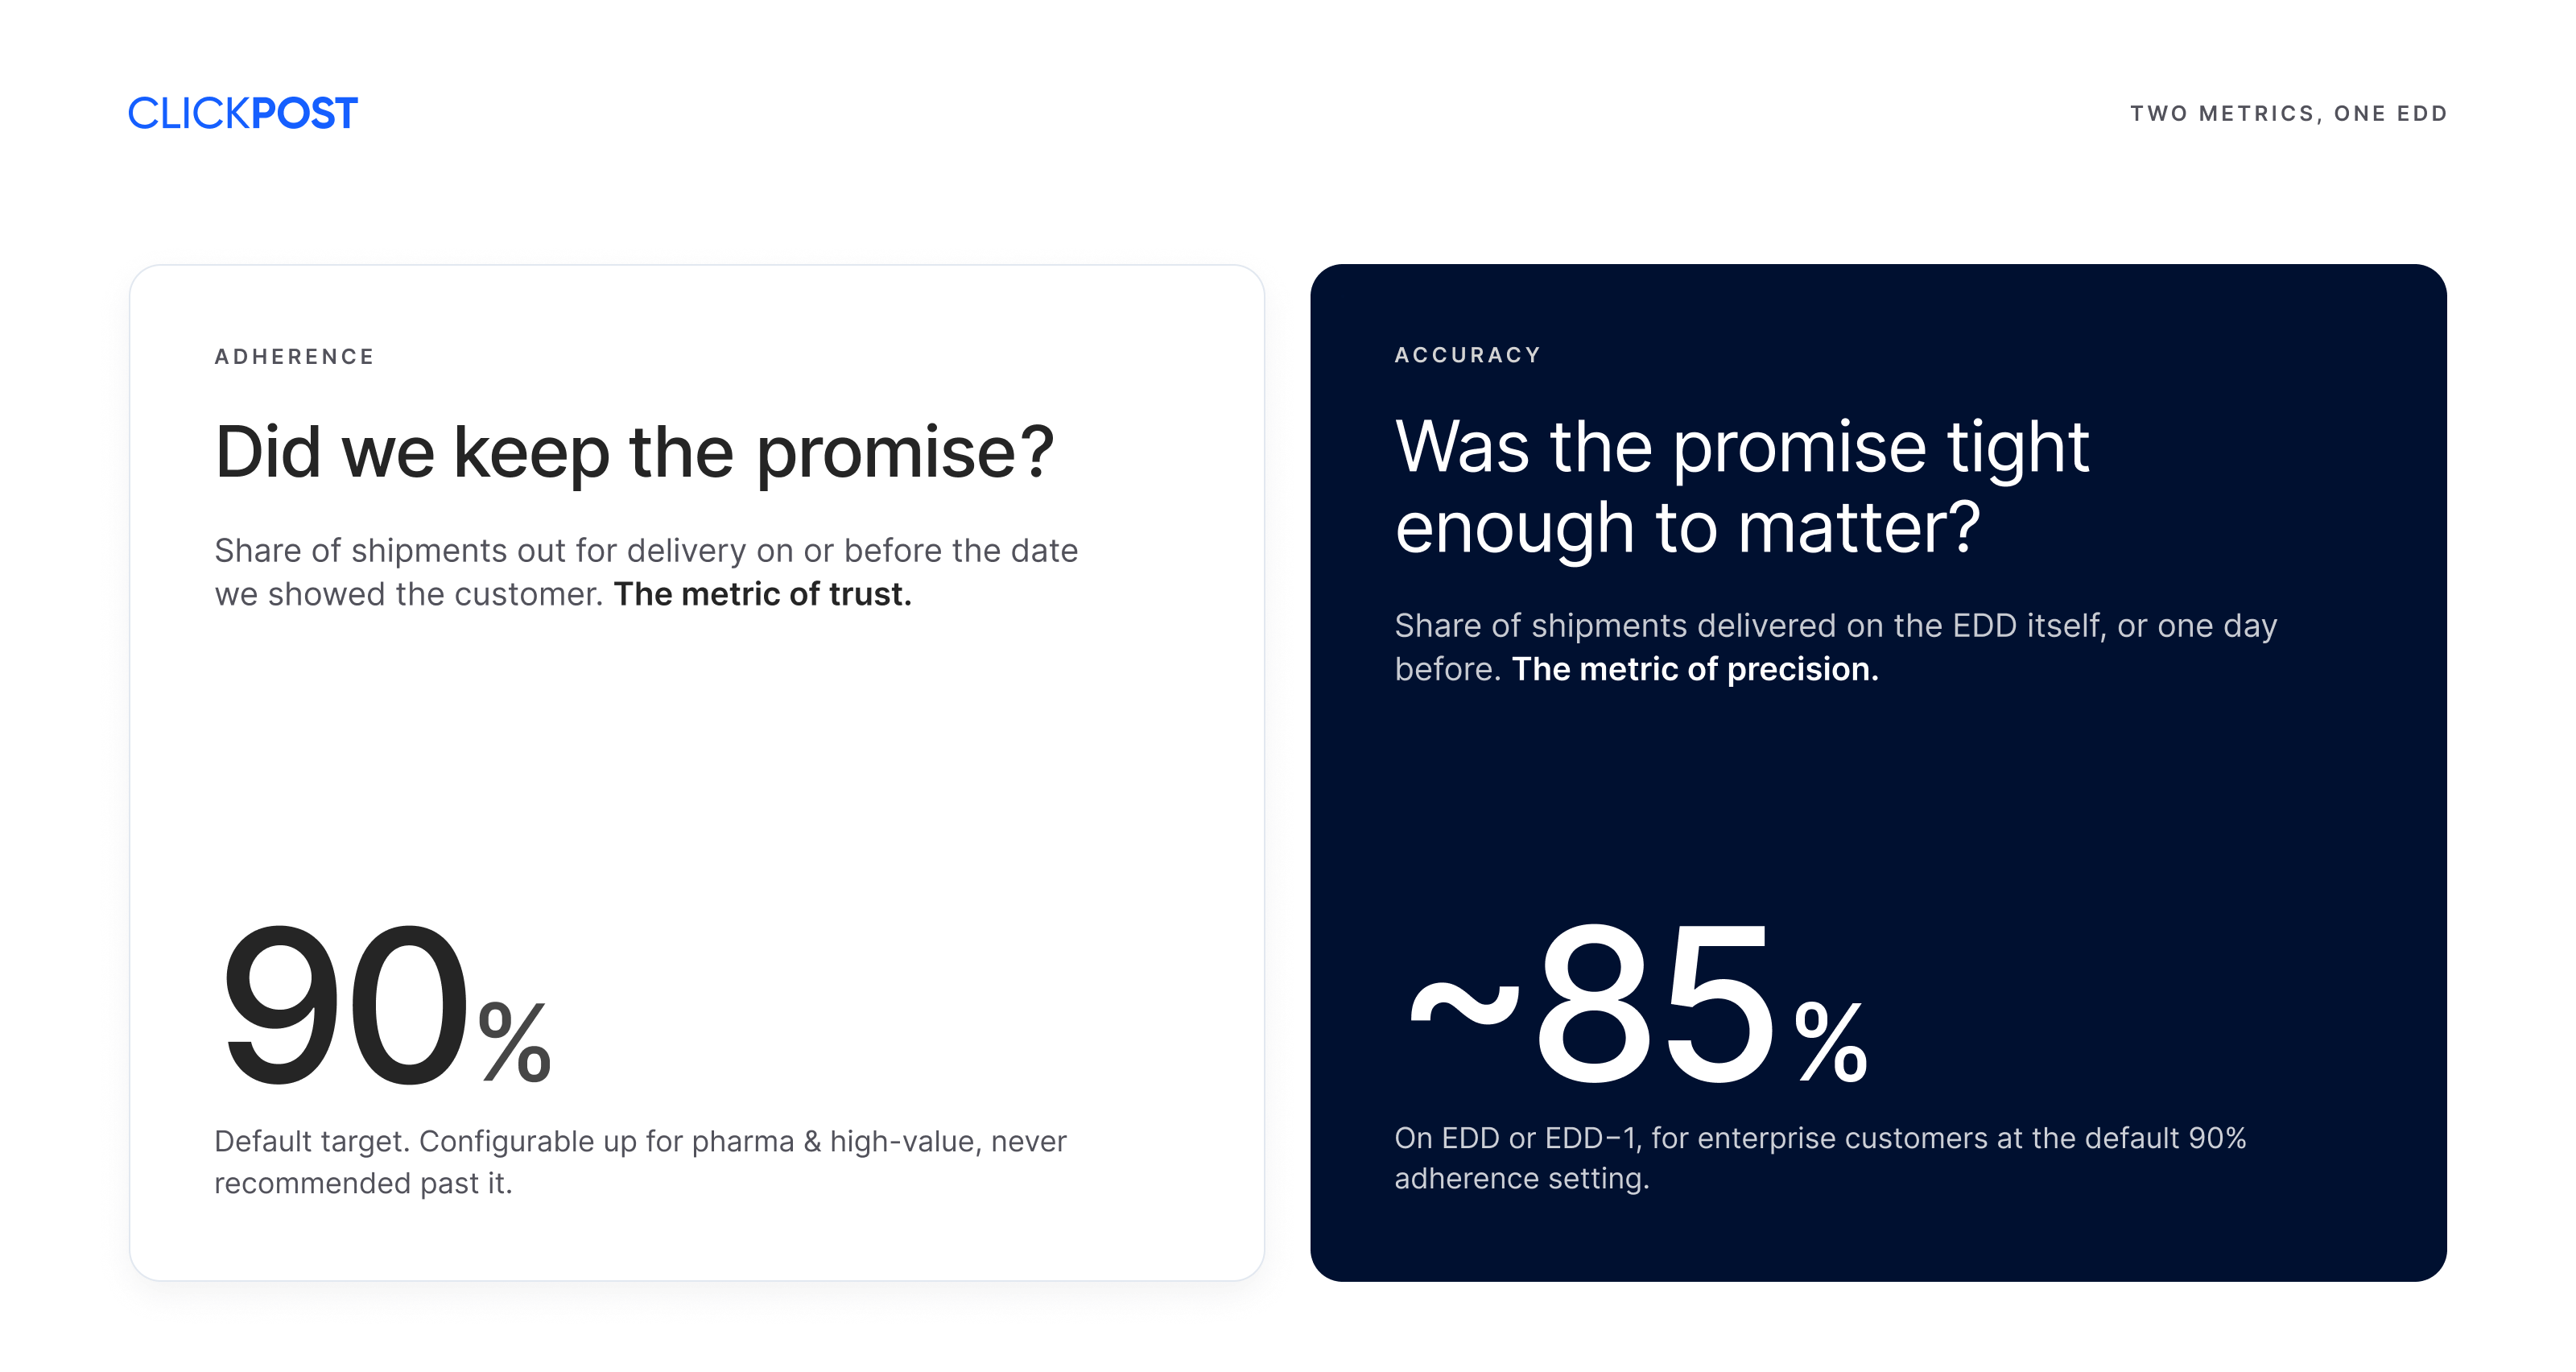
Adherence measures whether the shipment was delivered on or before the date we showed the customer. We look at the first out-for-delivery (OFD) date and check whether it falls within the EDD we promised. If yes, the shipment adhered. If no, it breached.
Adherence is the metric that governs trust. A customer whose package is out for delivery on or before the promised date has had their expectation met. A customer whose package is out for delivery after the promised date has not.
We default to a 90% adherence target on the ClickPost ML EDD, configurable higher or lower based on what the user wants. The tradeoff is direct: lower adherence targets produce a smaller buffer and a more aggressive EDD; higher adherence targets produce a larger buffer and a more relaxed EDD.
Measuring Precision with Accuracy
Adherence alone is insufficient. A system can trivially hit 100% adherence by promising a date three weeks out. The shipment will adhere, but the date is useless for driving conversion at the product page.
Accuracy measures how close the predicted date was to the actual delivery date. We track the percentage of shipments delivered on the EDD itself and on the day before the EDD (EDD-1), because those are the shipments where the promise was tight enough to matter.
For our default 90% adherence configuration, we see roughly 40% of shipments delivered on the EDD and 45% on EDD-1 for larger enterprises (shipping over 200,000 shipments a month). For smaller customers, where the model has less data on their specific lane mix, the numbers land around 30% on EDD and 50% on EDD-1.
The shape of this tradeoff is visible in production.
One anonymised D2C brand on the platform moved from ~55% accuracy and ~89% adherence on their previous configuration to ~75% accuracy and ~86% adherence after adopting the ClickPost ML EDD. A 20-point gain in accuracy against a 3-point dip in adherence.
-png.png?width=2828&height=1552&name=div%20(1)-png.png)
EDD Min and EDD Max
Because the prediction carries uncertainty, we also expose it as a range. EDD max is the date we commit to at the configured adherence level. EDD min is calculated such that the min-max range is likely to hold greater than 80% accuracy, meaning the shipment is expected to arrive somewhere inside that range with high likelihood. Clients who want to surface a single date use EDD max. Those who want to surface a window use the range.
The 90% Threshold: Why We Avoid Over-Padding Adherence
The most common question we get about the configurable adherence level is why 90% is the default, and why we do not recommend going higher. The intuitive answer is that more adherence is always better. In practice, it is not.
-png.png?width=3200&height=1932&name=Frame%20(2)-png.png)
The Buffer Problem
The relationship between adherence and buffer is a direct trade-off. To reach a 95% adherence target on a lane with inherent variability, the EDD must be padded enough to absorb the slower tail of shipments. While this ensures the promise is kept, it results in faster shipments arriving significantly ahead of the date shown, which creates a drag on conversion for the next customer viewing that promise at the product page.
We observed that beyond the 90% threshold, the required buffer forces the customer-facing EDD to exceed actual delivery times by margins wide enough to defeat the purpose of the prediction. The underlying model maintains its aggregate accuracy, but the date surfaced to the user loses its precision.
When to Push Higher
The configuration supports 95% adherence for customers who need it, typically in categories where the cost of a missed date outweighs the conversion cost of a padded one. Pharmacy and high-value shipments are the kinds of categories where this tradeoff usually favors the tighter adherence target. For general merchandise, 90% is the default: enough of the slower tail is caught to keep breaches manageable, and the EDD stays close enough to the actual delivery date to do its job at checkout.
Anticipating the Breach: The Engineering Logic of a Two-Model Cascade
An EDD produced at order time is based on the best information available at that moment. The shipment then enters a transit window where conditions can shift, and we need a way to detect while the shipment is still in motion that it is likely to breach its EDD.
This is a different problem from the original prediction. The original prediction is a regression: how many days. Breach detection is a classification: will this specific shipment miss its date, yes or no. So we built a separate model for it.
Two Checkpoints, One Coverage Window
A single model at a single checkpoint forces a tradeoff we did not want. A model that runs early catches shipments in time to act on them, but the signal is too weak to catch most of the breaches. A model that runs late has a strong signal but leaves little room for intervention.
We split the window instead. Two models, two checkpoints, tuned for the signal available at each.
-png.png?width=3200&height=1657&name=Frame%20(3)-png.png)
Model 1: The T-1 Pass
The first model runs at 5 pm on the day before the promised EDD. Its job is to flag shipments clearly off track, with enough lead time for the customer and the carrier to intervene.
At this checkpoint, we see a precision of roughly 90 to 92% and a recall of roughly 30 to 35%. In plain terms: when the model flags a shipment as likely to breach, it is right about nine times out of ten. It catches only about a third of the actual breaches, because the signal for the remaining two-thirds is not yet clear enough to flag with confidence.
We tuned deliberately for precision over recall at this checkpoint. A false alarm at T-1 pulls the client or carrier into investigating a shipment that was going to be delivered on time anyway, which has a real operational cost.
Model 2: The Same-Day Pass
The second model runs at 12 pm on the promised EDD itself. With the full set of scans leading into the day of delivery, the signal is much stronger.
Precision holds in the 90 to 92% range. Recall jumps to 80 to 85%, which means the second model catches the large majority of the breaches that the first model missed. The two passes cover the in-motion window without compromising precision at either checkpoint.
The Revised EDD
When either model flags a shipment as likely to breach, we recalculate the EDD to reflect the new timeline. The revised EDD is set as a flat 3 days over the original EDD. This is conservative: at the point of breach detection, the shipment no longer has the in-flight signal we would use to make a tighter prediction, so the revised date has to absorb the uncertainty.
With the flat 3-day buffer, we achieve roughly 87 to 90% adherence on revised EDDs. That sits slightly below the 90% target on original EDDs, which is the expected behavior. The shipments that reach breach detection are the ones whose initial trajectory has already diverged from the network-average path.
The Re-Prediction Loop in Production
The breach detection models are part of a larger loop that runs across the lifecycle of every shipment. The EDD shown at order time is the starting point, not the end state.
-png.png?width=3200&height=1684&name=Frame%20(4)-png.png)
Ingesting Tracking Events
Each carrier scan is a signal that can shift the prediction. We ingest these signals through a hybrid of webhooks and API polls. The polling cadence is bounded to prevent staleness. Issues that would previously have waited hours to surface are now detected in under 10 minutes, which is what the loop needs to keep the prediction current across the transit window.
Refreshing the Prediction
New scan data is fed back into the model and the transit estimate is refreshed. If the revised prediction has moved materially from the last one shown to the customer, the system updates the customer-facing EDD.
Updates are pushed through the channels the user has configured on ClickPost: email, SMS, WhatsApp, and the tracking page itself. If the user has set up a branded tracking page, the new EDD replaces the old one there. A notification goes out explaining that the date has shifted and what the new expected date is.
Internally, the revised EDD surfaces at-risk shipments in the operations view. Users can escalate to the carrier, reach out to the customer, or take whatever action fits their category.
Why Persistence Defines Predictability
A common error in last-mile engineering is treating the order-time prediction as the final product. While necessary, it is the update loop that determines whether a promise remains useful across the transit window. A prediction that was accurate at dispatch but becomes a miscalibration three days later, with no update, fails to manage expectations.
The re-prediction loop is what turns a static date into a running promise. The complexity lives in the orchestration: ingestion integrity, feature refresh, model invocation, change detection, downstream notification. Each component has to hold on its own and in combination.
What We Learned
Most of the engineering work in an EDD system is not the modeling itself. A regression model trained on the right features and the right corpus produces a reasonable prediction. The larger part is everything around the model: the ingestion pipeline that keeps the training data fresh, the breach detection cascade that catches what the initial prediction could not, the re-prediction loop that keeps the promise current, and the configuration surface that lets each user pick the point on the curve that fits their category.
A few things stood out.
-
Adherence is a tuning parameter, not a target. The useful question is not "how accurate is your EDD" but "at what adherence level does your accuracy hold up." The curve flattens somewhere around 90%, and that is where the default sits.
-
In-flight data beats historical data. Training on completed shipments lags the network by the length of the shipments themselves. Continuously retraining against in-flight shipments is what keeps the model responsive to conditions historical data would take weeks to register.
-
Classification complements regression. The regression model establishes the baseline expectation, but the classification models are what detect the divergence between that expectation and the network reality. Both are necessary; neither is sufficient on its own.
-
Corpus breadth matters most on the edges. The value of training across the full platform corpus is not in the high-volume lanes, where every model performs. It is in the long tail, where a narrow dataset produces over-precision and a broad one holds calibration.
A promise date is a small thing. It sits at the intersection of systems that have to work together to keep it true, and the engineering behind it is larger than the prediction itself.
ClickPost's EDD module
ClickPost's EDD module is the production system behind everything in this post. It powers pre-order and post-order delivery promises across 600+ carrier integrations and 50 million+ monthly shipments.
The module includes:
- A machine learning prediction engine trained continuously on in-flight shipment data across the full platform corpus, with lane, carrier, temporal, and seasonal features.
- Combination EDD, a configurable waterfall that lets brands compose ClickPost ML, courier-declared EDDs, and uploaded SLAs in any priority sequence.
- Adherence configuration at 90% by default, with a 95% option for high-stakes categories like pharmacy and high-value shipments.
- A two-model breach detection cascade that flags at-risk shipments at T-1 and same-day checkpoints, with revised EDDs pushed to customers automatically.
- An always-on re-prediction loop that ingests carrier scans, refreshes the prediction, and updates customers across email, SMS, WhatsApp, and the tracking page.
If you're evaluating an EDD system or rebuilding one in-house, book a demo with our team. We'll show you how it works on your carrier mix, your lanes, and your adherence target.