In this blog
TL/DR summary
The consumer electronics industry size has expanded steadily since 2018, with temporary dips, and the consumer electronics market is positioned for continued growth through 2028, led by smart TVs, gaming consoles, and connected home categories.
Key pointers
-
Stable market size ramp from USD 940.4bn (2018) to USD 1,176.8bn (2028), with short‑term fluctuations around 2022–2024.
-
Asia Pacific remains the demand engine; premium upgrades and energy efficiency features lead in mature markets.
-
Channel economics matter: optimise distribution channel mix between offline experience and e‑commerce platforms.
-
Watch the competitive landscape: Samsung Electronics, LG Electronics, Huawei Technologies, Sony Corporation, Panasonic Corporation, Dell Technologies, HP Development Company, and Toshiba Corporation anchor the global market.
Organizations that read the consumer electronics market data closely, invest in technological advancements, and deliver reliable service across channels will keep a durable edge as the global consumer electronics industry moves through the next cycle.
Year‑over‑Year Market Size and Growth
| Year | Market Size (USD B) | YoY Growth (%) | Absolute Growth (USD B) | E-Commerce Share (%) | Key Growth Driver | Top Region |
| 2018 | 940.4 | — | — | 27 | Smartphone upgrades & LED TVs | North America |
| 2019 | 974.8 | 3.7 | 34.4 | 30 | Wearables & streaming devices | Asia-Pacific |
| 2020 | 984.3 | 1 | 9.5 | 34 | Remote-work tech demand | North America |
| 2021 | 1,057.10 | 7.4 | 72.8 | 38 | Laptop & home-office electronics | North America |
| 2022 | 1,011.70 | −4.3 | −45.4 | 40 | Supply-chain slowdown | Europe |
| 2023 | 1,051.60 | 3.9 | 39.9 | 42 | Premium smartphones & IoT devices | Asia-Pacific |
| 2024 | 1,046.30 | −0.5 | −5.3 | 44 | Inflation impact on demand | Europe |
| 2025 | 1,077.20 | 3 | 30.9 | 48 | AI integration & smart homes | Asia-Pacific |
| 2026 | 1,108.10 | 2.9 | 30.9 | 51 | Smart TV & AR/VR adoption | North America |
| 2027 | 1,142.30 | 3.1 | 34.2 | 54 | Wearables 2.0 & IoT expansion | Asia-Pacific |
| 2028 | 1,176.80 | 3 | 3450.00% | 56 | Connected home ecosystems | Asia-Pacific |
Introduction
For operators in the electronics industry, decisions live or die by the data. Understanding the consumer electronics market helps leaders time launches, calibrate pricing, and prioritize distribution channel execution. It involves questions like how demand shifted from 2018 to 2023, where the global consumer electronics market is trending through 2029, and how segments behave.
This article translates market data through a business lens, using the latest available market-size series and segment snapshots to map opportunities and risks.
Global consumer electronics market: Size & trajectory
The consumer electronics market size series shows a cyclical yet upward trend over the forecast period. After a pandemic-era reset, demand broadened across electronic devices (from TVs to laptops), with replacement cycles and the adoption of smart devices supporting market growth.
Market size series (USD billions)
The size series from 2018 to 2028 shows a market that bends but does not break.
-
Revenues moved from USD 940.4bn (2018) to USD 974.8bn (2019) as smartphone refreshes and connected living rooms lifted spend.
-
2020 held at USD 984.3bn despite lockdown‑era supply chain disruptions as households redirected budgets to essential electronic devices.
-
In 2021, households upgraded at scale (work‑from‑anywhere, streaming, and gaming), pushing the market to USD 1,057.1bn.
-
Inflation and inventory corrections in 2022 pulled the market back to USD 1,011.7bn, before a 2023 normalization to USD 1,051.6bn as backlogs cleared and consumer demand stabilized.
-
The near-term plateaus at USD 1,046.3bn (2024), after which the forecast period resumes a steady climb.
-
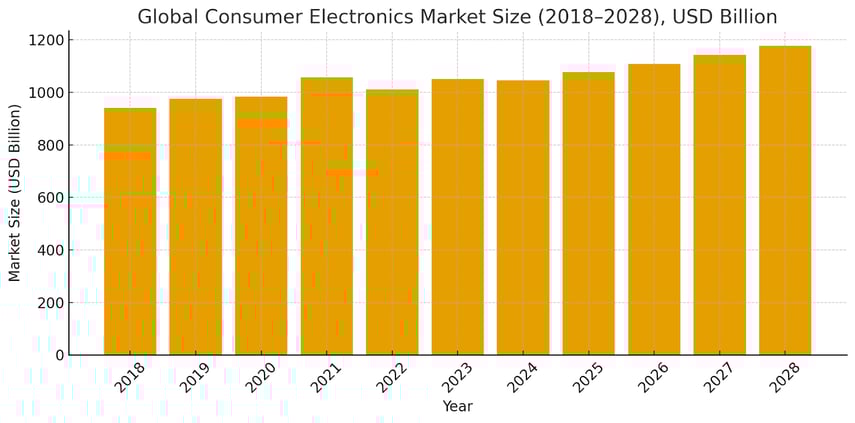
Projections show that the market is expected to reach a revenue of USD 1,077.2bn (2025), USD 1,108.1bn (2026), USD 1,142.3bn (2027), and USD 1,176.8bn (2028).
The underlying consumer electronics market trends point to steady market growth, even with supply chain disruptions and uneven consumer spending in certain years. Planning teams should anchor production windows to the 2025–2028 ramp while maintaining agile inventory for volatility.
Market size bar graph (2018–2028)
Segment view: Where demand concentrates
-
Telephony & mobile devices: Smartphones remain the keystone of the global consumer electronics market. This segment accounts for the largest share, rising from USD 446.1bn (2018) to USD 560.1bn (2028). The smartphone market underpins ecosystem revenue across wearables, audio, and cloud services.
-
TV, radio & multimedia: Smart TVs, audio, and digital cameras benefit from connectivity and streaming adoption. The market projections show a rise from USD 178.7bn (2018) to USD 209.9bn (2028). The core purchase drivers are picture quality and energy efficiency, as smart TVs and streaming ecosystems dominate living rooms.
-
Computing: From USD 286.9bn (2018) to USD 348.5bn (2028), laptops/tablets reflect hybrid work and study; enterprise‑grade silicon in consumer form factors sustains ASPs.
-
Gaming equipment: Gaming consoles and headsets extend upgrade cycles and premium attach rates. The market rose from USD 18.1bn (2018) to USD 37.7bn (2028). Demand spikes around major franchise releases and new‑gen launches.
-
TV peripheral devices: Small base, fast growth (USD 7.7bn in 2018 to USD 15.9bn in 2028), as streaming sticks, set‑top boxes, and smart remotes scale with OTT.
-
Drones: From USD 2.9bn (2018) to USD 4.7bn (2028); imaging, recreational mapping, and AI‑assisted flight keep the category expanding.
Consumer demand clusters around smart technologies that integrate seamlessly and deliver a competitive advantage in performance, battery life, and user experience.
Regional market signals
-
Asia Pacific: Scale and manufacturing depth drive the global market; rising disposable income in emerging economies sustains upgrades across smart devices and electronic products.
-
North America & Europe: Higher premium mix, strong interest in energy efficiency, and a consistent appetite for innovative products.
-
Middle East & Africa/Latin America: Digital infrastructure and internet access expansion expand the addressable market. At the same time, e-commerce platforms accelerate market expansion.
Country revenue snapshot
|
Country |
Market Revenue (USD Billion) |
|
China |
218.6 |
|
United States |
159.9 |
|
India |
73.1 |
|
Japan |
44.1 |
|
Brazil |
35.5 |
|
United Kingdom |
33.3 |
|
Germany |
28.1 |
|
France |
22.7 |
|
Indonesia |
21.4 |
|
Turkey |
18.8 |
Go‑to‑market & channels
The distribution channel mix remains pivotal. Offline retains strength in high-ticket trials and service, while online retailers and wholesalers capture growth through broader assortments, reliable delivery, and easier returns. Brands should localise warranty, finance, and service SLAs by regional market to protect their share.
Competitive landscape: Key players and signals
Samsung Electronics, Apple, Huawei Technologies, Sony Corporation, LG Electronics, Panasonic Corporation, Dell Technologies, HP Development Company, and Toshiba Corporation remain the key players shaping the competitive landscape.
Consumer electronics manufacturers that sustain research and development and integrate cutting-edge technology typically defend their market share more effectively.
-
Samsung Electronics continues to scale foldables and display leadership.
-
LG Electronics emphasises energy efficiency and smart home integration.
-
Huawei Technologies advances 5G devices.
-
Sony Corporation monetises gaming ecosystems.
-
Panasonic Corporation optimises home appliances.
-
Dell Technologies and HP Development Company focus on mobile computing and peripherals.
Historical growth (2018–2023)
From 2018 to 2023, the global consumer electronics market advanced with interruptions. COVID‑19 caused supply chain disruptions in 2020, but replacement and upgrade cycles lifted revenue in 2021.
A soft patch in 2022 reflected inflation headwinds, followed by a recovery in 2023 as consumer spending normalised. Net effect: a broadly expanding electronics industry with clear sensitivity to macro cycles.
Factors shaping the consumer electronics market
Drivers
-
Technological advancements: Integrating advanced technologies (AI/IoT), smart home appliances, and smart technologies fuel market growth and elevate stickiness.
-
Rising disposable income in the Asia Pacific and other emerging economies broadens the customer base and supports premium mixes.
-
E‑commerce platforms: Better discovery, instant comparisons, and last‑mile efficiency continue to fuel the market's growth and improve revenue generated per visit.
Constraints
-
Component cost volatility and policy shifts can slow market expansion; responsive sourcing and regionalisation mitigate shocks.
-
Privacy and compliance requirements add cost but also create differentiation for trusted consumer electronics brands.
Closing remarks: Translating data into advantage
The electronics industry rewards operators who pair market data with disciplined execution. The numbers above show a resilient consumer electronics sector, where smart devices, energy efficiency, and integrated ecosystems are shaping purchasing decisions.
Companies that tune product roadmaps to real consumer preferences, manage distribution channel economics with precision, and invest in after‑sales service will compound share through the forecast period.
In short: let the data guide portfolio bets, and keep the experience simple, secure, and sustainable.
Reference Sources