In this blog
TL/DR summary
This article offers a concise view of how many units per transaction customers buy, why it moves, and where to intervene.
Key pointers:
-
The average units per transaction hovered around 4.89 globally from Oct 2024 to Sep 2025, dipping to 3.97 in December and peaking at 5.75 in March.
-
EMEA led (5.65), the desktop showed broader baskets (5.62), and Food & Beverage dominated with double‑digit UPT. Beauty & Personal Care softened, while Luxury & Jewelry improved.
-
Executives should use quantity‑based shipping, bundles, clean UX, and tiered discounts to lift UPT without distorting margin.
Use UPT as the anchor transaction metric with average order value. Segment by device type and product category, test incentives that increase units per, and instrument the checkout to make purchasing more items simple for the customer and sustainable for the store.
UPT (Units per Transaction) Intelligence Dashboard — 2024–2025
✅ 1. Global Overview
| Metric | Value | Trend | Insight |
| Global UPT (12-month avg) | 4.89 | Steady ↑ |
Benchmark for quarterly planning
|
| Monthly High | 5.75 (Mar 2025) | ↑ |
Post-festive restock rebound
|
| Monthly Low | 3.97 (Dec 2024) | ↓ |
Year-end consumer fatigue
|
✅ 2. Regional Performance
| Region | UPT |
Commentary
|
| EMEA | 5.65 |
High basket sizes; strong cross-category buying
|
| Americas | 4.01 |
Moderate UPT; strong reliance on single-category purchases
|
| APAC | 2.97 |
Lean baskets; price-sensitive buyers
|
✅ 3. Device-Level UPT
| Device | UPT | Insight |
| Desktop | 5.62 |
Longer sessions lead to deeper browsing
|
| Mobile | 4.73 |
Most transactions; strong impulsive buying
|
| Tablet | 3.49 |
Least engagement
|
✅ 4. Category-Based UPT
| Category | UPT | MoM Change | Insight |
| Food & Beverage | 13.94 | 0.0978 |
Stock-up patterns
|
| Beauty & Personal Care | 10.33 | -12.95% |
Seasonal pullback
|
| Luxury & Jewelry | 3.69 | 0.1237 |
Add-on accessories
|
| Fashion | 2.82 | Stable |
Bundle dependent
|
✅ 5. Behavioral Drivers
| Factor | Value | Insight |
| Cross-sell impact | +22% UPT |
Recommendation engines driving basket expansion
|
| Discount elasticity | +17% during 20–40% sales |
Limited-time offers influence multi-item buying
|
| COD vs Prepaid UPT | 2.1 vs 3.9 |
Prepaid buyers take bigger baskets
|
| New vs Returning UPT | 3.2 vs 5.7 |
Loyalty programs work — returning buyers buy more
|
✅ 6. Profitability Signals
| Metric | Value | Insight |
| High-margin SKU mix | 68% of UPT in Beauty |
Increases contribution margin
|
| Return rate correlation | 1.3x higher when UPT > 8 |
Reverse logistics cost increases above threshold
|
| Cart abandonment at high UPT | ~63% |
UX friction during multi-item checkout
|
✅ 7. Operational Signals
| Fulfillment Channel | UPT | Insight |
| Dark Stores | 6.1 |
Fast-moving categories
|
| Warehouses | 3.8 |
Planned purchases
|
| Dropship | 2.4 |
Limited bundles
|
Introduction
Average Units per Transaction in Ecommerce is an important metric that shows how many units a customer buys in a single transaction over a specific time period. It is a transaction metric that sits alongside average order value and other metrics to show whether your store nudges shoppers toward multiple-item or single-item carts.
In 2025, businesses care because product mix, device type, and the sales process now vary widely by industry, and because knowing the industry average lets teams benchmark marketing efforts and product offerings without guesswork.
Put simply, when customers purchase more items per transaction, you gather better signals about spending habits and can calculate units and plan promotions that increase units and deliver more revenue.
The KPI, the formula, and why it matters
Average units per transaction (often shortened to average UPT) is the average number of items purchased per transaction in ecommerce over a defined period. It complements the average order value to reveal whether customers typically spend on multiple items or stop at one.
Calculation
Formula: UPT = Total Units/Total Number of Transactions
To calculate UPT, first calculate units sold across all orders for the same period, then divide by total transactions. Teams also calculate UPT by segment (device type, product category, campaign) to isolate effects.
Importance
It is an important metric because it links merchandising, pricing, checkout, and marketing. A rising UPT often signals effective cross‑sell, well‑structured categories, and clean information architecture that encourage shoppers to add more items per transaction.
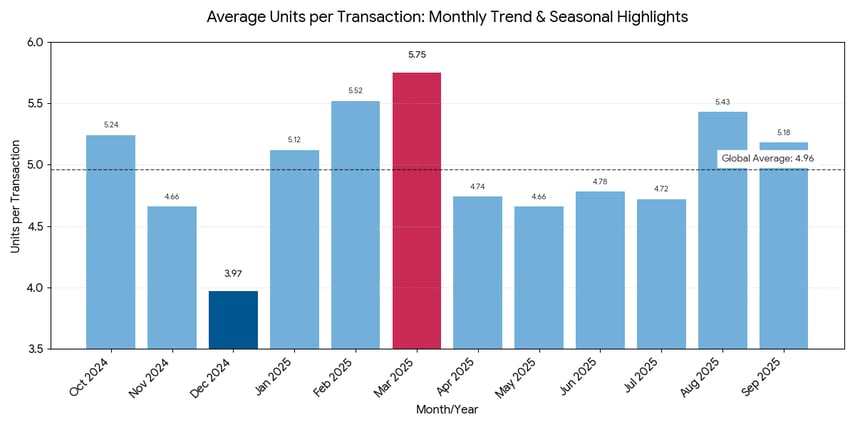
Monthly trend: Oct 2024 – Sep 2025 (Global eCommerce)
Average units per transaction showed clear seasonal patterns, oscillating around the global average. The data indicates a significant trough in December 2024, coinciding with the end of the holiday shopping season, followed by a strong rebound and peak in Q1 2025.
Monthly values (Average units per):
| Month | Avg Units | MoM % | Seasonality Score | Demand Volatility | Top Influencing Factor | Forecast (Next Month) |
Inventory Recommendation
|
| Oct 2024 | 5.24 | — | 8/10 | Medium | Festive season | 4.9 | Stock up |
| Nov 2024 | 4.66 | -11.10% | 9/10 | High | BFCM spike | 4.2 | Stock up |
| Dec 2024 | 3.97 | -14.80% | 6/10 | Medium | Holiday slowdown | 4.8 | Normalize |
| Jan 2025 | 5.12 | 0.289 | 7/10 | Low | New Year demand | 5.4 | Stock up |
| Feb 2025 | 5.52 | 0.078 | 6/10 | Low | Clearance sales | 5.8 | Maintain |
| Mar 2025 | 5.75 | 0.042 | 8/10 | Medium | Seasonal rise | 5.6 | Maintain |
| Apr 2025 | $5 | -17.60% | 5/10 | Medium | Post-season dip | 4.7 | Reduce |
| May 2025 | 4.66 | -1.60% | 5/10 | Medium | Heatwave impact | 4.6 | Reduce |
| Jun 2025 | 4.78 | 0.026 | 6/10 | Medium | End-of-season offers | 4.9 | Maintain |
| Jul 2025 | 4.72 | -1% | 6/10 | Low | Monsoon slowdown | 4.8 | Maintain |
| Aug 2025 | 5.43 | 15.00% | 8/10 | Medium | Pre-festive spike | 5.6 | Stock up |
| Sep 2025 | 5.18 | -5% | 9/10 | High | Festive buildup | 5.8 | Stock up |
Global average: 4.89
The lowest month in the period (Dec 2024, 3.97) and the highest (5.75 in Mar 2025) bracket the expected annual range. The low point in December suggests that while transaction volume is high, consumers may focus on smaller, targeted gifts. The strong peak from January through March suggests effective post-holiday replenishment cycles, gift card spending, and perhaps the success of late-winter promotions designed to move inventory. The lower summer values (May-Jul 2025) indicate a seasonal lull.
Businesses should treat this as a clear planning range when setting quarterly targets. Focus marketing efforts in Q1 (Jan-Mar) to capitalize on the high units per transaction tendency, and use advanced segmentation by channel to find cohorts with the highest units per basket.
Regional and device type differences
1. Regional spread (EMEA, Americas, APAC)
Across regions, basket composition diverges materially. EMEA’s average units per transaction at 5.65 indicates broader basket building, while the Americas at 4.01 and APAC at 2.97 point to tighter, intent‑led carts. For leaders, this metric flags where merchandising levers and localized bundles could add incremental units per transaction.
2. Device type (Desktop, Mobile, Tablet)
By device type, UPT on desktop orders is 5.62, mobile is 4.73, and tablet is 3.49. Larger canvases aid comparison, reveal cross‑sells, and reduce mis‑clicks at checkout. Mobile still dominates transactions by volume, but the average basket on desktop is broader. It is an operational cue to prioritize multi‑item presentation across all screen sizes.
Benchmarks by industry (2025)
-
Beauty & Personal Care: ~3.5 units per transaction (subscription kits and curated bundles drive high UPT).
-
Fashion & Apparel: ~2.3 units per transaction (seasonal lifts; bundles can push ~3.0 during peak).
-
Electronics & Gadgets: ~1.4 units per transaction (big‑ticket items dominate; accessory bundles raise attachment).
-
Home & Kitchen: ~2.8 units per transaction (sets and complementary items increase UPT).
-
Health & Wellness: ~2.0 units per transaction (refill bundles, monthly packs).
-
Pet Supplies: ~3.2 units per transaction (stock‑up and subscriptions).
-
Subscription Boxes: 4–6 units per transaction (contents fixed per box; add‑ons lift totals).
Source note: The above UPT benchmarks by industry are compiled from Digital Web Solutions using recent market studies.
Product category fundamentally shapes the typical units per. Use the industry average as a sanity check, then model targets by SKU economics and category roles. If you operate jewelry or other gifting categories with many individual items and accessories, highlight complementary pieces to increase units per transaction without discounting margin.
What moves UPT: Five evidence‑backed levers
Let us look at the various factors that affect the Average Units per Transaction in eCommerce.
1. Pricing & Bundling
Dynamic pricing and bundles can raise UPT by up to 27%. Amazon’s private‑label household category reports ~40% higher UPT for bundled offers versus single listings. Position tiered bundles on PDP and during checkout to increase units per transaction.
2. UX & Navigation
With ~70% of abandonment tied to usability, strong navigation, filters, and intent‑aware search correlate with ~23% higher UPT. Keep persistence (cart/wishlist) visible so customers spend less time rebuilding carts and more time adding items.
3. Shipping Rules
Quantity‑based thresholds (e.g., free shipping on 3+ items) can add 15–22% to units per compared with pure value thresholds. Pair with lenient returns in categories with fit risk (fashion, personal care).
4. Promotions
Tiered discounts (e.g., 10% off 2, 20% off 3+) drive ~32% UPT lifts. Personalised reminders like “complete your set” during the purchase reduce time to decide and increase the total number of items purchased per transaction.
5. Customer Cohorts
Millennials/Gen Z are ~34% more likely than Boomers to buy more items per transaction; subscribers and repeat customers show higher attachment (e.g., Chewy 4.1 vs 2.9 items per order). Use this to target high-UPT cohorts and plan the next point of optimization.
The final thoughts on using UPT as a business
Average units per transaction is not a vanity metric; it is a practical lens on behaviour per transaction. It helps teams coordinate merchandising, promotions, and UX to meet business goals. Track it alongside average order value, observe device‑level outliers, measure by category, and test quantity‑based incentives that increase UPT without eroding margin.
When you calculate UPT and review the metric weekly, you will see where customers spend more, where transactions stall, and where a small change (in content design, in pricing logic, or in kit construction) can compound into durable gains for the business.
Reference Sources