In this blog
TL/DR summary
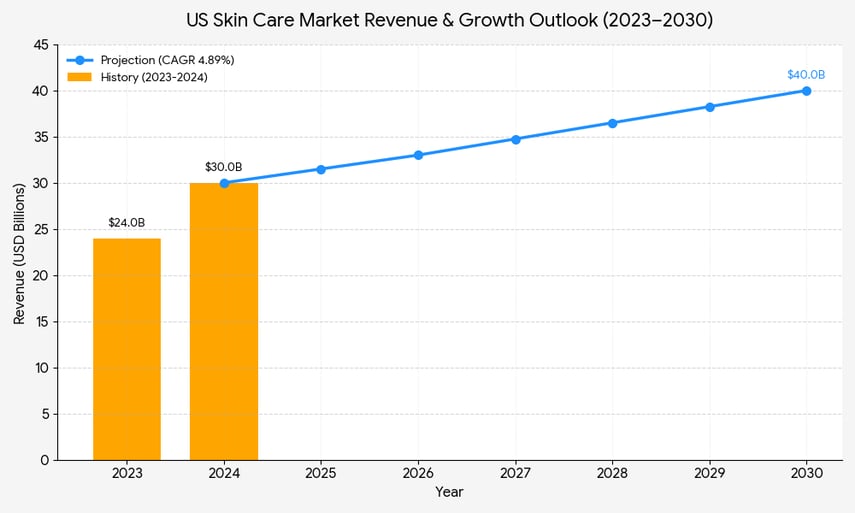
The US skin care market value rose from ~$24B (2023) to $30.01B (2024) and is on track to reach $39.81B by 2030 at a ~4.88% CAGR. Demand concentrates in facial care, body care, and sun protection, with clean labels and efficient anti-aging solutions setting the tone. Stores still matter for discovery while e‑commerce handles replenishment; ingredient literacy and credible natural ingredients keep shaping choices.
Key pointers:
-
Weight assortments to replenishment leaders (face wash, moisturisers, SPF) and measured anti-aging claims.
-
Keep price ladders stable; avoid perpetual promos; watch distribution channels' unit economics.
-
Invest in diagnostics and first‑party data; cite Grand View Research and internal market report work when sizing bets.
-
Use specialty stores for education and convenience stores for trial‑size reach; maintain content parity across distribution channel mixes.
-
Monitor Asia Pacific textures and filters for import‑ready ideas.
Build trust, ship proof, and let the numbers govern the next cycle of growth.
The US skincare market synopsis
| Topic | Figure |
Implication
|
| US 2023 value | ~$24B |
Pre-surge baseline for forecasting
|
| US 2024 value | $30.01B |
Updated anchor for budgeting
|
| 2030 projection | $39.81B |
Steady, predictable expansion
|
| CAGR (to 2030) | ~4.88% |
Growth requires disciplined innovation
|
| Best-selling units (2023) | Face wash/cleansers 247M; acne treatment 110M |
Focus on replenishable SKUs
|
| Channel preference | 61% store; 27% desktop online |
Omnichannel strategy remains essential
|
| Global baseline | $181.2B (2023) → $210B (2028) |
US remains top value market
|
| Fastest-growing category | Serums + retinol treatments |
Prioritize high-velocity product lines
|
| Demographic driver | Gen Z + Millennials |
Adjust messaging toward skin health and ingredient transparency
|
| Ingredient trend index | Niacinamide, peptides, ceramides |
Invest in evidence-backed formulations
|
| Price tier dominance | Masstige leading |
Brands should position mid-range for best volume
|
| TikTok influence index | ~28% of purchases |
Viral trend monitoring needed
|
| Subscription adoption | ~22% of US skincare buyers |
Build refill & membership programs
|
| Refund rate | ~8–12% for skincare |
Optimize expectation messaging & returns workflow
|
| Sustainable packaging trend | 40% prefer eco-friendly |
Branding should lean into sustainability
|
Introduction
The US Skin Care Market is a high‑information arena where category breadth, ingredient literacy, and service design meet scale. Leaders now treat the skincare industry as a data system: read the skincare market signals, segment by distribution channel, and align portfolio choices with measurable shifts in consumer preferences.
With a larger domestic base than any other country and a steady pipeline of tech‑enabled routines, the skin care market is shaped by elevated disposable income, ingredient transparency, and pragmatic routines that emphasise skin health over hype. This article converts current facts into operating guidance for US businesses.
Market size and trajectory (United States)
A clear view of market size removes noise. Updated valuations place 2024 at $30.01B, up from ~$24B in 2023, with a straight‑line path (via a compound annual growth rate near 4.88%) to $39.81B by 2030.
For businesses, that slope implies resilient market growth even as the competitive landscape intensifies. Plan pricing, promotions, and inventory to that envelope; let the market report cadence drive your capex and launch calendar across the forecast period.
US Skincare Market Revenue 2023–2030
Structure of demand: What people buy and why
Before chasing growth, understand the product's market composition within the broader skincare market.
Core product category mix
-
Facial care dominates the skin care products market: creams, serums, and face wash anchor everyday usage; facial skincare products like masks and balms extend regimens.
-
Body care maintains volume through lotions and hand/foot care; everyday replenishment stabilises retail sales.
-
Sun protection is non‑negotiable; SPF‑forward moisturisers compress steps and support healthy skin and skin quality outcomes.
-
Clean‑leaning ranges using natural and organic ingredients are gaining shelf space as natural skincare products mature.
In assortments, weight the product category mix toward replenishment SKUs; use targeted storytelling for outcomes (hydration, texture, anti-aging support) rather than vague benefits. Where possible, connect benefits to recognisable actives (e.g., hyaluronic acid).
Channels and distribution: Where conversion happens
The distribution channel picture is plural. Speciality stores and prestige counters set the pace for education; convenience stores capture impulse and minis; and online platforms and DTC streamline replenishment. Maintain consistent GTINs and content across distribution channels to avoid assortment drift; use market share by channel to prioritise media.
Remember that North America still leans toward store‑led discovery while the Asia Pacific playbook shows faster social‑to‑cart motion; borrow mechanics, not assumptions. For mass retail, ensure convenience stores and drug channels carry the same hero SKUs as e‑commerce to maintain credible price ladders.
Consumers and usage patterns
The US skincare industry is supported by increased awareness and simplified routines.
Shoppers value quality, price, and scent; routines are tightening (“skinimalism”) while efficacy remains the filter. Personal care attitudes put functionality ahead of decoration; results‑focused care products retain loyalty.
Skincare routines shift from multi‑step stacks to targeted kits that address specific skin concerns (acne, tone, moisture) with fewer, better skincare products. Expect steady market growth as ingredient literacy rises.
Growth themes and headwinds
-
Key trends: cleaner labels, refill systems, inclusive shade‑adjacent solutions (for hyperpigmentation), and data‑guided diagnostics.
-
Key industry trends: AI diagnostics, tele‑consults, and virtual sampling underpin assortments and lower returns.
-
Technological advancements enable lab‑grown actives and peptide work. You must use impact‑based claims, not buzzwords.
-
Rising demand for credible natural ingredients continues, but avoid greenwashing; invest in testing.
-
Margin pressure persists due to saturation; sharpen retail math and limit broad market share chases.
Competition and notable players
The field mixes heritage houses and fast‑scalers. Estée Lauder Companies and Johnson & Johnson Services operate at scale across multiple product category lanes, while challengers leverage DTC to win niches. Track key players and leading players by sub‑segment (derm‑led, clinical, masstige).
Maintain a living market report and qualitative analysis of launches to spot white space. Research shows data relevant to triangulate overall market direction across North America, the Middle East, and the Asia Pacific regions.
Global context
While the US leads in value, the global skincare market and broader adoption continue to expand. Asia Pacific remains the innovation engine (formats, textures, filters), informing import strategies and co‑manufacturing. Use this context to balance domestic hero SKUs with imported textures that convert in US climates.
Risks and controls
Supply continuity for botanicals and actives can wobble; mitigate with multi‑sourcing and buffer inventory for top care products. Regulatory shifts (MoCRA) increase documentation burden—fold compliance into the launch gate. Promotional fatigue erodes equity; protect pricing architecture and avoid constant markdowns.
Closing remarks on the US Skin Care Market
The US skincare market offers a reliable market size trajectory, disciplined distribution channel execution, and a portfolio tilted toward high‑velocity care products that deliver outcomes. Blend clean chemistry with proof, let skincare companies publish real data, and back claims with service.
The winners will pair boringly excellent replenishment with a few unforgettable launches, measured by returning customers and durable market share.
Reference Sources