In this blog
TL/DR summary
A steady-growth US cosmetics market sits at US$21.45bn (2025), compounding at ~3.74% to 2030. Value pools are concentrated in color cosmetics (face/eye), with North America remaining central to global influence. Offline is large; online is scaling fast. Sustainability, personalization, and science‑backed claims will separate signal from noise.
Key pointers
-
2025 baseline: US$21.45bn; per‑capita US$62.42; non‑luxury ~68.4% of sales.
-
Forecast: 3.74% CAGR to 2030, which will translate to about ≈ US$25.77bn by 2030.
-
2024 segment anchors: face ≈ US$4.5bn, eye ≈ US$3.6bn, lip ≈ US$0.54bn.
-
Channels: offline 71.17% (2023) with e‑commerce platforms growing ≈ 7.1%.
-
Demand shape: women ~61.40% (2023); men’s CAGR ~6.6% to 2030.
-
Competitive set: Estée Lauder Companies, Procter & Gamble, Shiseido Company Limited, Avon Products Inc. These are niche brands scaling via social media.
Plan for steady compounding, design bold assortments around face/eye, and win channel by channel with transparent claims and measurable consumer value.
Forecast table: US cosmetics, planning view (2025–2030)
| Year |
Market Size (US$ bn) |
Growth Assumption (YoY) |
Notes |
| 2025 | 21.45 | 3.74% | Baseline: U.S. cosmetics market leadership within single‑country revenue; non‑luxury ~68.4% |
| 2026 | 22.25 | 3.74% | Mix opportunities in color cosmetics and skin care; online sales channels scaling |
| 2027 | 23.08 | 3.74% | Benefit from market expansion in men’s grooming; improved shade systems |
| 2028 | 23.95 | 3.74% | Efficiency via portfolio pruning; retailer exclusives support market share |
| 2029 | 24.84 | 3.74% | Packaging re‑designs (eco‑friendly packaging) and refill formats deepen loyalty |
| 2030 | 25.77 | 3.74% | Digital diagnostics and service‑led add‑ons mature; steady compounding. |
How to use this table: Anchor your internal industry analysis to 2025, then stress‑test scenarios (+/‑ 150–250 bps vs. base cosmetics market growth) to plan inventory and cash.
Introduction
Beauty is a serious business in the United States. Behind every viral shade drop and refillable compact is a disciplined engine of distribution, pricing, and demand planning that powers the category. For decision-makers, the US cosmetics market size is not just a headline number; it is a scoreboard for channel strategy, assortment choices, and capital allocation. In 2025, cosmetics revenue in the United States is estimated at US$21.45 billion, with non‑luxury accounting for 68.4% of sales and per‑capita revenue around US$62.42.
What pushes the momentum? A mix of rising online sales channels and persistent strength in specialty stores, high product launch velocity, and consumers who are willing to trade up for performance, transparency, and convenience. Understanding the numbers (and what lies beneath them) helps brands and retailers set guardrails for investments, sharpen market-growth bets, and align operations with changing consumer preferences.
U.S. cosmetics market overview: Growth, trends, and dynamics
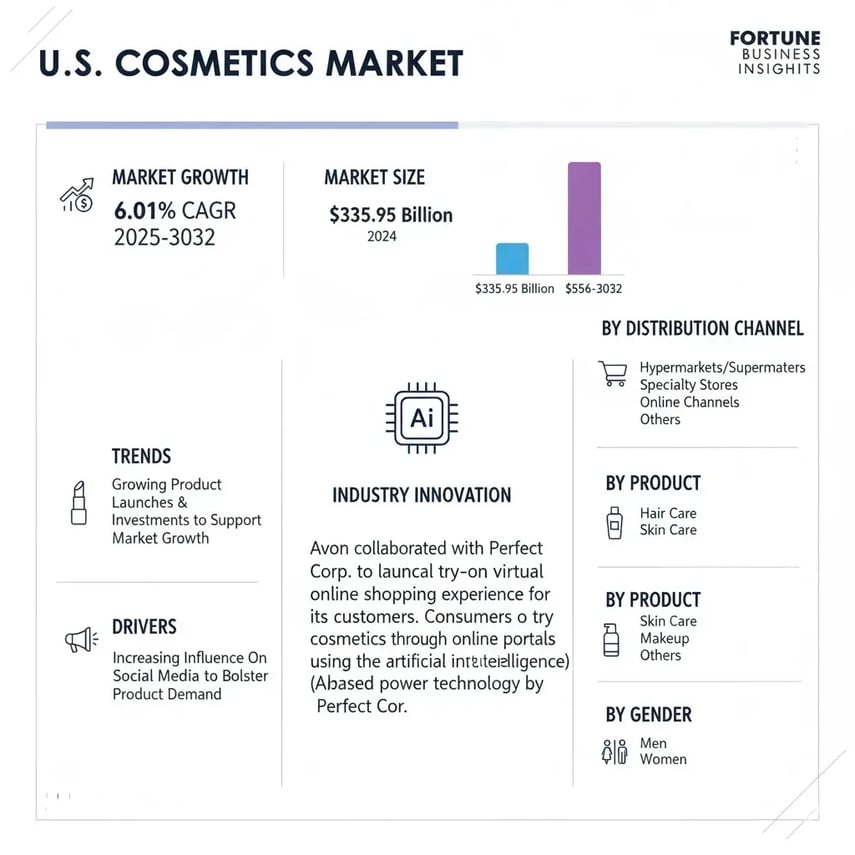
As per the Grandview Research, the U.S. Cosmetics Market is projected to grow substantially, expanding at a Compound Annual Growth Rate (CAGR) of 6.01% between 2025 and 2032 (forecast period). This growth will see the market size increase significantly from $335.95 billion in 2024 to an estimated $556.21 billion by 2032.
Key trends bolstering this market include rising new product launches and increased investments to support overall market expansion. The primary drivers of demand are rooted in the growing influence of social media, which shapes consumer preferences and drives product sales.
In terms of industry development, notable innovations, such as the collaboration between Avon and Perfect Corp., are enhancing the consumer experience. This partnership has introduced a virtual try-on online shopping experience, allowing customers to experiment with cosmetics through AI-powered online portals.
The market's reach spans several distribution channels, including Hypermarkets/Supermarkets, Specialty Stores, Online Channels, and other retail channels. Product offerings in the market are segmented into Hair Care, Skin Care, Makeup, and other categories. Finally, the market caters to both men and women across its various product lines.
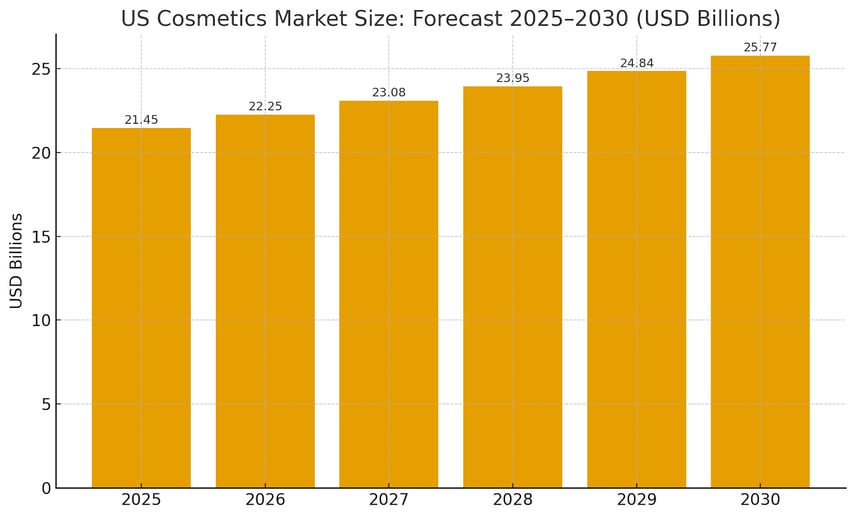
US market size & forecast (2025–2030)
According to Statista, a clean forecast provides operators with a planning spine. Using the 2025 baseline (US$21.45bn) and the stated CAGR (3.74%), here is what the data converts into.
The curve suggests room to compound through mix upgrades (higher-margin color cosmetics and skin care sets), improved distribution channel orchestration, and replenishment-led AOV growth. Steady growth helps inventory and working-capital discipline while enabling selective bets in natural cosmetics, eco‑friendly packaging, and personalized beauty solutions.
Market size bar graph (2025–2030)
Structure of demand: Segments & where value concentrates
Category lens (2024 anchor to inform 2025)
Color cosmetics remain a value engine. Face (~US$4.5bn) > Eye (~US$3.6bn) > Lip (~US$0.54bn). This ordering indicates that complexion and eye SKUs continue to command the largest baskets, aided by shade expansion and better wear-time claims.
Rising attachment to skin care and hair care boosts basket sizes across routines; skin health claims and hybrid cosmetic products blur the lines between makeup and care.
End‑user lens
Women account for ≈61.40% (2023), but the men’s opportunity is real, with ~6.6% CAGR expected through 2030. Grooming, scalp solutions, and multi‑benefit formats are the entry points.
Channel lens
Specialty stores and other offline formats retain scale (≈71.17% in 2023) thanks to discovery and sampling, while online sales channel penetration accelerates (≈7.1% CAGR to 2030). Balanced investments across e‑commerce platforms and brick‑and‑mortar safeguard reach and margin.
Regional context
North America remains a core revenue pillar of the global cosmetics market; Asia Pacific expansion adds long‑run optionality for US‑born cosmetics brands with export ambitions.
Competitive landscape & share dynamics
-
Key players shaping the US cosmetics sector include Estée Lauder Companies/Estée Lauder Companies Inc., Procter & Gamble, Shiseido Company/Shiseido Company Limited, and Avon Products/Avon Products Inc. These are firms with broad portfolios and deep capabilities in R&D, supply, and retail partnerships.
-
Challenger niche brands win by speed: ruthless SKU edits, transparent claims, and community‑driven launches on social media platforms.
-
What to watch: company market share moves via M&A, incubators, and retailer exclusives; share often correlates with market research‑led innovation, omnichannel execution, and the ability to enhance customer engagement at launch and during replenishment.
Themes shaping the next leg of growth
-
Consumer preferences favor clarity on ingredients and outcomes. The consumers are moving towards more natural ingredients, fewer synthetic chemicals, and credible ethical sourcing narratives.
-
Eco‑friendly packaging and sustainable beauty products shift from ‘nice‑to‑have’ to table stakes, especially for environmentally conscious consumers.
-
Personalized beauty solutions (shade‑matching, diagnostic tools) and technological advancements in formulas/testing create a competitive edge.
-
Persistent market dynamics: rapid drops, short cycles, and high trial. Companies need agile S&OP and responsive media to turn social media spikes into repeatable market revenue.
US within the global picture
-
The United States accounts for ~21.28% of the global cosmetics market revenue and remains a bellwether for claims, shades, and price bands that later travel cross‑border.
-
Expect continued interplay with Asia Pacific innovation cycles, as K‑beauty/J‑beauty textures and formats inform US launches; reciprocal flows will influence global cosmetics market size and market share shifts.
Brand & retail implications (Action checklist)
-
Distribution channel balance: protect discovery in specialty stores while accelerating online sales channels with sampling and try‑before‑you‑buy mechanics.
-
Portfolio design: weight color cosmetics toward face/eye value pools; keep skin care tie‑ins to raise repeat rates.
-
Data discipline: tight feedback loops from social media and DTC analytics to guide drops; deploy market research to validate claims and protect the company's market share.
-
Sustainability cred: embed ethical sourcing and eco‑friendly packaging; make verification visible.
-
Partnerships: leverage retailers and platforms aligned to your target audience; use co‑created sets to defend shelf and page real estate.
The final thoughts on the US cosmetics industry
In the current cycle, the US cosmetics market is defined by steady compounding, disciplined channel design, and nimble storytelling. The baseline is strong with a scale that supports R&D and nationwide reach. At the same time, the upside is powered by faster online penetration, richer consumer behavior data, and better science, translating into performance claims customers can feel.
For operators, the path is clear: stay close to the customer, build assortments where consumer spending is resilient, and use transparent innovation (backed by market research) to convert fleeting trends into durable market share. The opportunity is not to chase every spark, but to catch the right ones and feed them with the right distribution channel, the proper proof, and the right economics.
Reference Sources