.png?width=879&height=549&name=Page%2074%20(1).png)


In this blog
TL/DR summary
The top online shopping categories globally, by revenue, are consumer electronics, Fashion, Food, and Beverages, with US rankings showing Fashion on top. Growth momentum (Food, Household Essentials, Beverages, consumer electronics, and Furniture) signals where to place smart bets. Mobile commerce and social commerce now orchestrate most discovery and a growing share of conversion; marketplaces dominate first‑touch, while online stores and mobile apps secure loyalty.
Key pointers:
-
Use the global and US revenue anchors to set category‑level market share goals.
-
Prioritise mobile shopping UX and search engine hygiene; meet consumers' shopping behaviour where it starts.
-
Test subscriptions in Food, Beverages, and personal care to drive repeat purchases.
-
Allocate incremental budget to growth categories and promote via social media channels.
-
Align logistics promises with category norms to avoid returns drag.
Keep a tight read on online shopping categories and move inventory behind what customers actually buy, not what the calendar suggests.
Top online shopping categories:
| Shopping Category | Global Revenue | Note | Return Rate (%) |
Logistics Complexity
|
| Consumer Electronics | $922.5B | Fast cycles | 8–12% | High |
| Fashion & Apparel | $760B | High frequency | 25–35% |
Medium-High
|
| Food | $460.1B | Replenishment | <1% |
High (cold chain)
|
| Beverages | $248.7B | Subscriptions | 1–3% | Medium |
| DIY & Hardware | $220.2B | Heavy items | 5–8% | High |
| Furniture | $220.1B | AR assists | 5–10% |
High (bulky)
|
| Media | $193.9B | Mixed formats | 1–3% | Low |
| Beauty & Personal Care | $169.6B | Loyalty | 4–6% | Medium |
| Tobacco | $116.6B | Regulations | <1% | Medium |
| Toys & Hobbies | $89.8B | Collector demand | 3–7% | Medium |
Introduction
Top online shopping categories remain a moving target because consumer behaviour shifts with devices, discovery channels, and fulfilment promises. For leaders, the point is not simply to chase viral items but to study online shopping data, read category momentum, and align assortment with customer expectations.
The categories that dominate search, baskets, and ecommerce sales shape pricing playbooks, merchandising, and working capital. Understanding online shopping trends and the composition of shopping categories helps an online business choose the right product categories, allocate marketing spend, and decide what to stock in a physical store versus what to prioritize for shopping online.
This article consolidates the latest directional numbers on online shopping categories and translates them into practical signals for US leaders operating ecommerce websites and online stores.
Mapping the field: Global category revenue and share
A sensible entry point is the list of worldwide shopping categories' revenue. Use these anchors to frame market share, then adapt to your brand’s product category and unit economics.
Global leaders by revenue (Worldwide)
-
Consumer Electronics: $922.5B forecast. Scope ranges from smartphones and PCs to drones and smart‑home gear. Broad catalogues and rapid cycles keep this category among the top online shopping categories.
-
Fashion & Apparel: $760B expected. Assorted fits, colourways, and drops create frequent online purchase cycles.
-
Custom Apparel Growth: with the global POD market projected to grow from about $12.96 billion in 2025 to over $100 billion by 2034, and apparel accounting for the largest revenue share (~39%), according to 2026 statistics from Printful and Printify.
-
Food: $460.1B projected, accelerated by online grocery shopping and quick‑commerce fulfilment.
-
Beverages: $248.7B projected; specialty coffee/tea and premium segments underpin high demand.
-
DIY & Hardware: $220.2B forecast as comparison, and doorstep delivery beats store‑carry friction.
-
Furniture: $220.1B projected; DTC disruptors and flexible returns normalise bulky online shopping experience.
-
Media: $193.9B projected across physical/digital mixes.
-
Beauty & Personal Care: $169.6B projected; kits and refills support repeat purchases.
-
Tobacco Products: $116.6B projected amid regulatory and substitution dynamics.
-
Toys & Hobbies: $89.8B projected; education and collector niches sustain demand.
Global totals shape your pricing strategies and inventory depth, but popularity among online shoppers can diverge from revenue. At the same time, online shopping habits also impact global eCommerce sales. Track trending products and “breakout” items within each online shopping category to avoid stale stock.
The US picture: Category revenue and mix
The US mix mirrors global patterns, with a few flips that matter for online businesses planning their assortments.
-
Fashion: $162.9B (top earner among US shoppers). Drops, collabs, and returns handling define margin.
-
Food: $125.6B; baskets are routine and replenishment‑heavy.
-
Consumer Electronics: $120.1B; attachments and warranties drive margin.
-
Beverages: $111.6B; premiumization and subscriptions add stickiness.
-
DIY & Hardware: $108.6B; research‑first buyers rely on content and reviews.
-
Furniture: $74.5B; logistics promises make-or-break conversion.
-
Media: $37.7B.
-
Beauty & Personal Care: $28.4B.
-
Toys & Hobbies: $21.2B.
-
Luxury Goods: $14.9B.
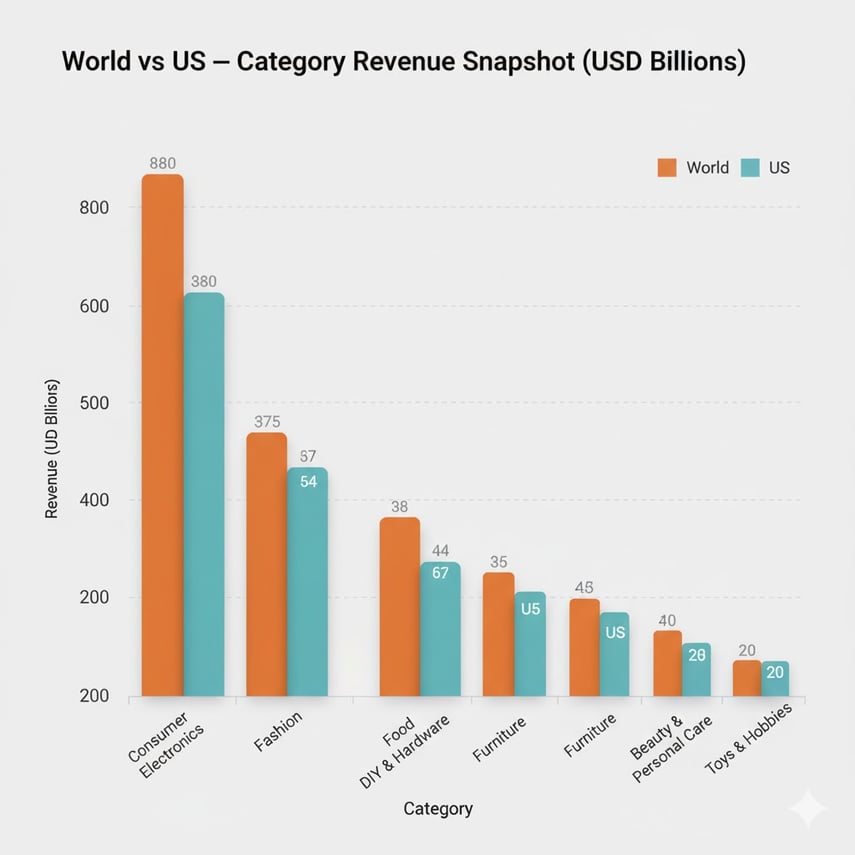
Bar graph: “World vs US — Category Revenue Snapshot” compares overlapping categories to show relative market share.
Growth and popularity: Where momentum lives
Beyond headline revenue, trajectory matters. When ranking by annual revenue change rather than totals, the popular online shopping categories list shifts:
-
Food: +51.6% in 2020, then +24.1% current projection; durable behavior shift to shopping online for everyday essentials.
-
Household Essentials: +39.6% in 2020; 22.2% expected increase—steady replenishment logic.
-
Beverages: +18.9%; premium niches help AOV resilience.
-
Consumer Electronics: After a 2022 dip, +18.1% projected for 2024; upgrades and accessories revive demand.
-
Furniture: +17% expected; visualisation tools and generous returns narrow the gap with physical stores.
So what? Momentum categories deserve test budgets on social commerce, curated bundles, and faster PDP‑to‑cart flows. Watch Google Trends and search engines for nascent signals and skew your mobile apps catalogues accordingly.
Channels and devices: Who orchestrates demand
-
Online marketplaces capture the largest share of online purchases; Amazon’s scale and frequency make it a de facto search layer for internet users.
-
Mobile devices now drive nearly 80% of retail website visits and the majority of orders globally; in several Asian markets, mobile contributes 70%+ of ecommerce sales.
-
Social commerce is set to account for at least 20% of total retail sales within digital commerce, making social media channels a primary venue where consumers shop and shop online directly.
Optimize PDPs for mobile shopping, keep checkout under three steps, offer free shipping thresholds, and align media with the category covers you lead. For items, people still want to shop in-store, use local inventory ads, and drive‑to‑store messaging from mobile commerce placements.
Strategy notes for merchants by product category
Based on the data, the following strategies can help stay competitive in the marketplace.
-
Consumer Electronics: Invest in attachment architecture (cases, chargers, warranties). Calibrate online store taxonomy around ecosystems (e.g., phone + wearable + home device) to increase multi‑line online purchases.
-
Fashion & Apparel: Use size/fit tools and post‑purchase loopbacks to defend margin. Creators on social media platforms accelerate discovery among younger customers and female shoppers.
-
Food & Beverages: Lean into subscriptions and delivery windows. Convenience beats price in many online retail missions.
-
DIY, Furniture: Rich content and AR shorten consideration. Clarify delivery SLAs in the eCommerce store's PDPs to reduce cart abandonment.
-
Beauty & Personal Care: Bundle refills and samples; average order value rises with smart cross‑sell.
-
Toys & Hobbies: Community content matters; hobby supplies thrive on launch calendars and loyalty.
|
Scope |
Shopping Categories / Metric |
Figure |
Note |
|
Worldwide revenue leaders |
Consumer Electronics |
$922.5B |
Broad catalogues, fast cycles |
|
Fashion & Apparel |
$760B |
High frequency, returns‑sensitive |
|
|
Food |
$460.1B |
Replenishment + delivery |
|
|
Beverages |
$248.7B |
Premium niches, subscriptions |
|
|
DIY & Hardware |
$220.2B |
Heavy/complex items suit delivery |
|
|
Furniture |
$220.1B |
DTC disruptors, AR assists |
|
|
Media |
$193.9B |
Mixed formats |
|
|
Beauty & Personal Care |
$169.6B |
Kits, refills, loyalty |
|
|
Tobacco Products |
$116.6B |
Regulatory headwinds |
|
|
Toys & Hobbies |
$89.8B |
Education/collector demand |
|
|
US revenue leaders |
Fashion |
$162.9B |
Top among US shoppers |
|
Food |
$125.6B |
Routine baskets |
|
|
Consumer Electronics |
$120.1B |
Attachments drive margin |
|
|
Beverages |
$111.6B |
Premiumisation |
|
|
DIY & Hardware |
$108.6B |
Research‑heavy purchases |
|
|
Furniture |
$74.5B |
Logistics‑sensitive |
|
|
Media |
$37.7B |
||
|
Beauty & Personal Care |
$28.4B |
||
|
Toys & Hobbies |
$21.2B |
||
|
Luxury Goods |
$14.9B |
||
|
Growth (global) |
Food |
+24.1% proj. (after +51.6% in 2020) |
Behavior change endures |
|
Household Essentials |
+22.2% proj. |
Replenishment cadence |
|
|
Beverages |
+18.9% proj. |
Premium tiers |
|
|
Consumer Electronics |
+18.1% in 2024 |
Upgrade cycles |
|
|
Furniture |
+17% proj. |
Visualisation/returns |
|
|
Channels & devices |
Mobile share of visits |
~80% global |
The majority of orders too |
|
Asia's mobile share of sales |
70%+ |
China and South Korea exemplars |
|
|
Online marketplaces |
Largest share |
Amazon ~6B visits in Q1 2024 |
Closing remarks on the top online shopping categories
The top online shopping categories are a moving curve, not a fixed list. Winners combine sharp category focus with flexible channels: emphasise mobile devices, deepen social commerce, and let marketplace presence validate catalogue fit while your owned online stores capture repeat value.
The discipline is simple: track category market trends, test with modest buys, and scale what converts. In a year where ecommerce growth remains structurally positive, the merchants who balance velocity categories with defensible differentiation will compound advantage, online and, where it still fits, in physical stores.
Frequently Asked Questions
1. What are the top online shopping categories in India?
Online shopping in India has witnessed a rise in categories like fashion, electronics, home goods, and beauty products, with fashion leading as the most popular category. These segments cater to a wide range of consumer preferences and price points, offering convenience and variety to online shoppers.
2. Which are the most popular consumer products across different categories?
Popular products vary by category, but top sellers include smartphones in electronics, apparel in fashion, kitchen appliances in home goods, and skincare products in beauty. These products are in high demand due to their relevance and affordability.
3. What are the popular consumer products by price range across categories?
Price-sensitive consumers often look for budget-friendly options, such as affordable fashion accessories, smartphones under ₹15,000, and home gadgets under ₹3,000. Meanwhile, premium options include high-end electronics, luxury apparel, and top-tier home appliances.
4. What is the best consumer product list across categories to buy online?
Some of the best products to buy online include smart TVs, fitness trackers, ethnic wear, home decor items, and skincare products. These items are known for their high demand and customer satisfaction.
5. Which product categories contribute the most to online sales revenue in India?
Fashion, electronics, and home goods contribute significantly to online sales revenue. Fashion alone accounts for a large portion of the sales, driven by the diversity of products ranging from apparel to accessories.
6. What are popular products to buy online across various price ranges?
From budget-friendly smartphones and fashion accessories to premium home appliances and high-end electronics, the range of popular products spans across all price categories. Shoppers are increasingly looking for value-for-money products with quality and durability.
7. What are the most popular categories in e-commerce marketplaces in 2026?
In 2026, the most popular categories in e-commerce are expected to be electronics, home improvement, fashion, and health & beauty. These categories are growing due to advancements in tech and consumer interest in personalized products.
8. What are the most popular online shopping categories by revenue?
Categories like fashion, electronics, and home appliances continue to lead in terms of revenue, with fashion experiencing significant growth due to increasing demand for both luxury and affordable options.
9. What consumer products are trending across categories with references?
Popular consumer products across categories include products like wireless earbuds (electronics), athleisure wear (fashion), air fryers (home goods), and beauty serums (personal care). These trending items are backed by consumer reviews and market reports.
10. Which are the top products to recommend across different online shopping categories?
Top product recommendations include smartphones under ₹30,000, fashion staples like jeans and jackets, home appliances such as coffee makers, and skincare essentials like face creams and serums. These items offer good value and cater to varying budgets.
11. What is the growing popularity of product categories in online shopping?
As online shopping continues to evolve, categories like home fitness equipment, electric vehicles, and sustainable fashion are rapidly gaining popularity. These trends reflect changing consumer lifestyles and increased environmental awareness.
12. How do product categories compete in the online marketplace in 2026?
Fashion, electronics, and home goods categories are experiencing fierce competition, with brands constantly innovating to attract consumers. While fashion relies on trendiness, electronics and home goods focus on functionality and affordability.
13. What are the most popular consumer product recommendations across categories?
Recommendations for popular products include fitness trackers, noise-canceling headphones, versatile kitchen appliances like mixers, and daily-use fashion items. These products are widely recommended due to their practicality and customer reviews.
14. What are some of the most popular online shopping categories in 2026?
By 2026, popular online shopping categories are expected to include AI-powered home gadgets, sustainable fashion, and wellness products. These categories align with consumer trends toward technology, sustainability, and self-care.
15. Which product categories are the fastest growing in online shopping today?
The fastest-growing product categories in online shopping today are health and wellness products, followed by smart home devices and eco-friendly fashion. These sectors are experiencing rapid growth driven by changing consumer demands and innovation.