In this blog
TL/DR summary
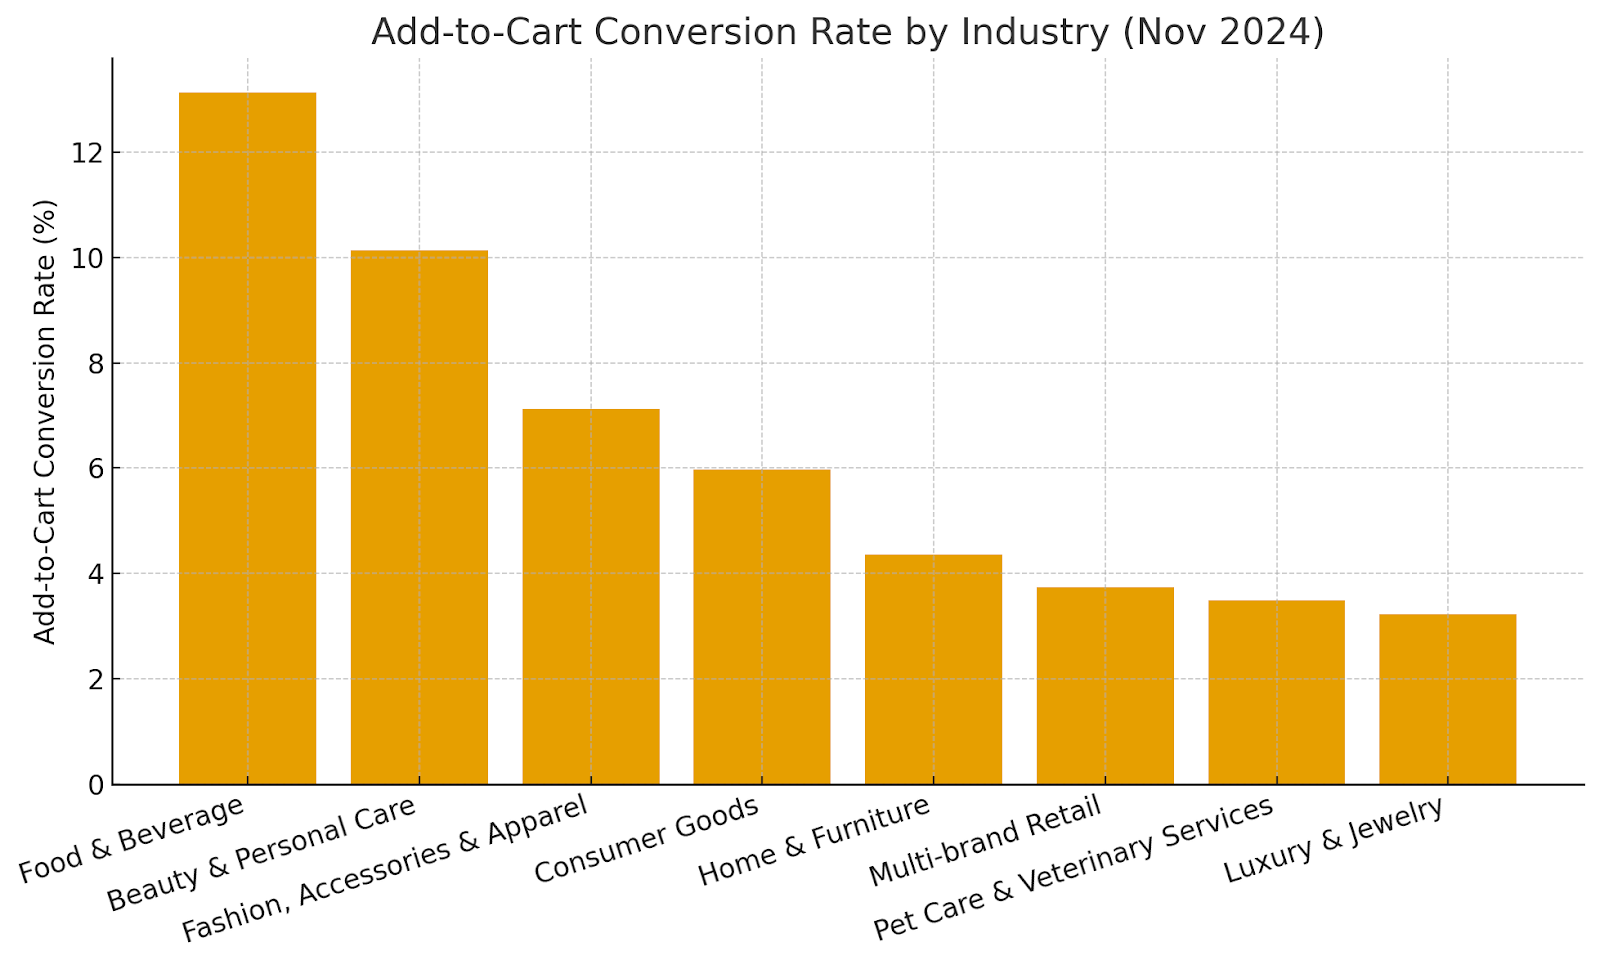
Add-to-cart is a leading indicator of demand quality. In November 2024, food & beverage (13.14%) and beauty (10.14%) topped add-to-cart rates; luxury sat at 3.23%. The global average hovered near 6.34% across the last year, with mobile devices slightly higher at the add stage. Use PDP depth, pricing clarity, and speed to raise intent.
Key pointers
-
Align traffic with relevant products to protect conversion rate quality.
-
Improve product pages and trust signals to increase add-to-cart conversions.
-
Streamline the checkout flow to increase cart conversion rates without blanket discounts.
-
Monitor device splits; save mobile add-to-carts and recover them later on desktop.
-
Track adjacent KPIs: average ecommerce conversion rate, average order, and repeat purchases.
Treat add-to-cart like an early health check—optimize the moments that earn the click, and downstream conversion rates will follow.
Summarizing the numbers
|
Industry |
Add-to-Cart Conversion Rate (Nov 2024) |
|
Food & Beverage |
13.14% |
|
Beauty & Personal Care |
10.14% |
|
Fashion, Accessories & Apparel |
7.12% |
|
Consumer Goods |
5.98% |
|
Home & Furniture |
4.36% |
|
Multi-brand Retail |
3.74% |
|
Pet Care & Veterinary Services |
3.49% |
|
Luxury & Jewelry |
3.23% |
Introduction
Add to cart is the moment curiosity turns into intent. In this guide on add-to-cart conversion rate by industry, we define the metric, unpack verified benchmarks, and interpret what the latest numbers imply for merchandising, pricing, and the customer journey. For ecommerce teams, understanding where your conversion rate sits versus peers helps prioritize fixes, allocate budgets, and strengthen forecasting.
We use the most recent industry data you shared to frame practical decisions for ecommerce stores across categories, regions, and mobile devices.
What the metric means: A quick primer before the deep dive.
Add-to-cart conversion is the share of website visitors who add at least one item to a cart during a session. It is a valuable indicator of product-market fit, pricing resonance, and on-page UX.
While only a fraction of adders will purchase, rising add-to-cart rates generally predict a healthier pipeline and higher conversion rates downstream. Teams track it alongside average order value, average conversion rate, and repeat purchases to judge funnel quality.
Formula: Sessions with an add ÷ Total sessions × 100.
The current picture: Global benchmarks and momentum
The global averages put the add-to-cart conversion rate near the mid–single digits, with device and vertical outliers shaping the results.
Key insights and modern analysis
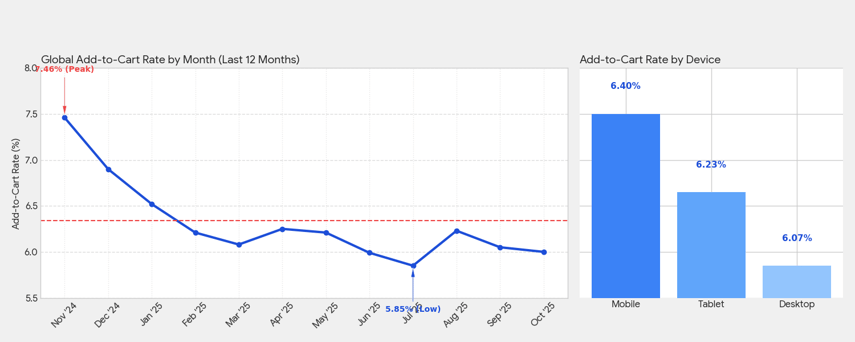
The global average add-to-cart rate stands at 6.34%. It highlights a dynamic and seasonally sensitive metric in the e-commerce funnel. The line chart below clearly demonstrates seasonality, peaking at 7.46% in November 2024 (likely driven by holiday shopping) before steadily declining through the summer months, hitting a low of 5.85% in July 2025.
The bar chart comparing devices shows that mobile users are the most active shoppers, with the highest add-to-cart rate of 6.40%. This mobile dominance (where the customer shows high intent to purchase by adding items to the cart) underscores a critical strategic point. At the same time, mobile users are the first to engage, but many e-commerce platforms still struggle to finalize the sale on mobile devices, resulting in a lower mobile conversion rate further down the funnel.
Businesses should therefore prioritize optimizing the mobile checkout experience to capitalize on this high initial engagement fully.
If you are a business, treat add-to-cart as a leading KPI. When rates dip while traffic rises, you are attracting interest without intent. Tighten landing pages, refine relevant products, and verify site speed.
Add-to-cart conversion rate by industry (November 2024)
Below are the last year’s benchmarks. Each conversion rate is the share of sessions with at least one add-to-cart.
Food & Beverage — 13.14%
Performance sits well above the global average. Low consideration cycles, time-sensitive needs, and subscriptions lift add-to-cart conversion rates. Promotional triggers and social proof (freshness, reviews) sustain momentum. Watch per-order margins so costly incentives do not offset rising conversion rates.
Beauty & Personal Care — 10.14%
A strong add-to-cart rate reflects habitual replenishment and persuasive UGC. User-generated content and shade-matching guidance improve confidence. Expect volatility when price points shift or bundles change. This vertical often records higher conversion rates than discretionary fashion.
Fashion, Accessories & Apparel — 7.12%
Sizing risk and returns temper conversion rates. Detailed fit guides, generous exchange policies, and clear images lift add-to-cart conversion rates without crushing margins. In Q4, gifting nudges add to carts upward.
Consumer Goods — 5.98%
The consumer goods industry shows steady intent when availability is clear and shipping costs are predictable. Smart conversion rate optimization includes reorder cues and household multipacks.
Home & Furniture — 4.36%
Long evaluation cycles and higher-priced baskets suppress conversion rate. Use AR previews, lead times by ZIP, and financing to raise add-to-cart rates and increase eventual cart conversion.
Multi-brand Retail — 3.74%
Traffic skews exploratory, so conversion rates are lower. Use sharper navigation, collections, and intelligent cross‑sell blocks to convert browsing into add-to-cart.
Pet Care & Veterinary Services — 3.49%
Prescription friction and shipping windows keep conversion rates modest. Subscriptions, predictable delivery, and vet-approved content help. The pet care segment benefits from reminders around dosing and weight-based sizing.
Luxury & Jewelry — 3.23%
High trust thresholds and high ticket items delay action, so the average conversion rates and add to cart rates are lower. Virtual try-on and concierge chat can move qualified traffic to cart conversion without blanket discounting.
Chart: Add-to-cart conversion rate by industry (Nov 2024)
Regional notes and device nuance
-
By region, Americas ~6.67%, EMEA ~6.29%, APAC ~5.03% for add-to-cart conversion.
-
The Middle East is seeing marketplace-led growth; social discovery drives traffic to quick add-to-cart options, but longer checkout deliberation.
-
On devices, mobile users show quick intent on PDPs, yet desktop still wins the later-stage conversion rate. Use targeted ads to return mobile adders to a saved basket.
Why conversion rates diverge
Market competition, content depth, and total cost clarity drive conversion rates apart.
-
Product pages: richer specs and reviews raise conversion rate. Thin pages depress add-to-cart rates, even with substantial traffic.
-
Pricing and fees: surprise totals harm cart conversion. Transparent promos and free thresholds help ecommerce stores hit higher conversion rates.
-
Experience: fast PDPs and obvious CTAs nudge users to add to cart. Use image compression and caching to improve site speed.
-
Trust and proof: badges, delivery windows, and social proof ease first‑timers' risk.
Benchmarks vs. broader eCommerce performance
Use these adjacent KPIs to keep context.
-
Average ecommerce conversion rate (sitewide purchase) typically trails add-to-cart by several points; channels with low-funnel traffic post higher average conversion rates.
-
Category elasticity: Replenishment categories see higher conversion rates; multi-brand retail and discovery-heavy verticals see lower conversion rates.
-
Channel mix: Email and organic search usually beat paid search in terms of average conversion rate and cart conversion.
Tactics that lift add-to-cart (Without blunt discounts)
-
Sharpen relevance: Align creatives to user intent and route to matching landing pages or collections.
-
Strengthen PDPs: Comparison tables, sizing, and back‑in‑stock alerts raise add-to-cart conversion.
-
Reduce friction: One‑tap add-on mobile devices, progress cues in checkout flow, and saved carts across sessions.
-
Personalize: Recently viewed, complementary sets, and intelligent cross‑sell raise micro‑commitments.
-
Automate: Use AI-powered tools to spot drop‑off and trigger nudges; keep the conversion funnel clean.
Closing perspective: Moving from curiosity to commitment
Add-to-cart is where discovery becomes decision. The industries posting the strongest conversion rates pair clear value with low friction, while laggards carry complexity that stalls intent. Benchmark against the figures here, watch device patterns, and refine online store experiences that make intent effortless.
The compounding gains are real: small rises in add-to-cart conversion rates cascade into healthier ecommerce conversion rates, higher average order values, and more durable lifetime value.