In this blog
TL/DR summary
Cart abandonment remains high, led by mobile and high‑consideration categories. The biggest triggers are unexpected costs, account requirements, payment trust gaps, and slow shipping. Fix transparency issues, simplify the checkout process, expand payment options, and clearly state return policies.
Key points
-
Device gaps matter: mobile abandonment at 85.65%; design the checkout flow for small screens.
-
Price clarity first: 48% exit on fee shock; show totals early in the online shopping cart.
-
Let buyers pay without delay: guest checkout and multiple payment options reduce drop‑off.
-
Trust wins: security badges and clear language around payment details reduce anxiety.
-
Delivery clarity: communicate dates and choices upfront to deter customers from leaving.
-
Measure and iterate: track cart abandonment rates, checkout flows, and recovery rate as weekly operators’ metrics.
Treat cart abandonment as a system problem. Map the shopping journey, remove surprises, and keep the purchasing process simple. Small, compounding fixes across pricing, trust, and checkout design recover lost sales at scale.
Summarizing the data
|
Category |
Metric / Reason |
Value |
|
Device |
Desktop cart abandonment |
73.07% |
|
Device |
Mobile cart abandonment |
85.65% |
|
Device |
Tablet cart abandonment |
80.74% |
|
Reason |
Unexpected costs at checkout |
48% abandon |
|
Reason |
Cannot estimate the total cost early |
21% abandon |
|
Reason |
Mandatory account creation |
26% abandon |
|
Reason |
Credit card trust issues |
25% abandon |
|
Reason |
Site security doubts |
19% abandon |
|
Reason |
Limited payment options |
13% abandon |
|
Reason |
Complicated or lengthy checkout |
22% abandon |
|
Reason |
Slow or limited shipping options |
21% abandon |
|
Reason |
Unfriendly return policy |
18% abandon |
|
Reason |
Difficulty with promo/discount codes |
8% abandon |
|
Industry |
Automotive cart abandonment rate |
85.97% |
|
Industry |
Travel cart abandonment rate |
82% |
|
Industry |
Luxury & Fashion cart abandonment rates |
68% – 88% |
|
Industry |
Home furnishing cart abandonment rate |
90.5% |
|
Industry |
Jewellery cart abandonment rate |
84.5% |
|
Industry |
Retail cart abandonment rate |
67% |
|
Industry |
Grocery cart abandonment rate |
52% |
Introduction
Cart abandonment is the silent tax on ecommerce sales. It happens when a customer adds items to a shopping cart and leaves before paying, turning intent into lost sales and slowing growth. In today’s market, leaders watch the shopping cart abandonment rate as closely as conversion rates because the pattern reveals friction in pricing, trust, checkout design, and delivery promises.
With device‑level cart abandonment rates ranging from about 73% on desktop to nearly 86% on mobile, the gap between interest and completed purchases is still vast.
For businesses, reading these signals well means better revenue capture, fewer discounts, and a cleaner customer journey.
The cart abandonment metric and the stakes
Before the causes, align on terms and why the metric belongs on the operator’s dashboard.
Definition and context
Cart abandonment occurs when a customer adds one or more items to a shopping cart but does not complete the purchase. The shopping cart abandonment rate measures the share of initiated shopping carts that do not become completed purchases. Many ecommerce sites treat this alongside conversion rates to find where checkout flows create friction. High cart abandonment rates usually signal problems earlier than sales revenue declines do, giving teams room to intervene.
What businesses should watch?
Use the shopping cart abandonment rate to prioritize fixes with the biggest revenue impact. Analyze user behavior using funnel tracking to see where customers drop off. If most drop-offs occur before the checkout page, clarity around content and pricing is likely an issue. If there exists a cluster inside the checkout process, the checkout experience and payment trust are the culprits. In either case, cart abandonment statistics help teams recover lost revenue without over‑relying on blanket discounts.
Device and industry benchmarks
A clear view of where cart abandonment stands today helps teams set expectations and target the right frictions.
Device view
As per the data, here are the device-wise cart abandonment rates:
-
Desktop: 73.07% cart abandonment.
-
Mobile: 85.65% cart abandonment.
-
Tablet: 80.74% cart abandonment.
Smaller screens compress the checkout flow and make forms more complicated to complete. Prioritize a mobile‑first checkout design, show order summaries persistently, and reduce taps. Streamline the checkout process by reducing fields and enabling guest checkout.
 Industry view
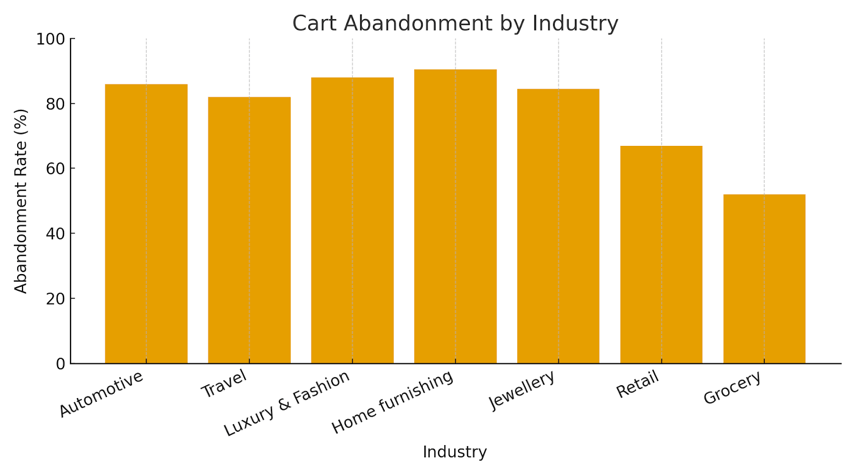
The data shows industry-wise cart abandonment rates as follows.
-
Automotive: 85.97% cart abandonment rates due to high‑ticket decisions and configuration complexity.
-
Travel: 82%; long forms and comparison shopping inflate exits.
-
Luxury & Fashion: 68% – 88%; size uncertainty and browsing behavior drive abandoned carts.
-
Home furnishing: 90.5%; large baskets and longer research windows amplify abandonment.
-
Jewellery: 84.5%; similar high‑consideration patterns.
-
Retail: 67%; shipping fees and slow sites are common triggers.
-
Grocery: 52%; intent is high, so friction tends to be operational rather than desire.
Many ecommerce stores battle category‑specific frictions. For high‑ticket categories, reassure with financing options, clear delivery timelines, and strong customer testimonials. For fast‑moving goods, focus on speed, inventory accuracy, and clear time‑to‑deliver.
Top reasons for cart abandonment: The data and what to do
Below, we unpack the most frequent causes using the provided figures. Each section starts with a summary, then moves on to the practical fix for ecommerce retailers.
Unexpected costs and fee shock
48% of online shoppers leave when extra costs appear late; 21% exit when they cannot estimate the total cost early.
Why it happens: Extra costs like shipping costs, taxes, and service fees surface at the last step, creating distrust and sticker shock. Surprise customers at the end, and many customers will abandon.
What to do: Be transparent about extra costs on product pages and in the online shopping cart. Show shipping estimates and taxes early. Use a cost estimator module so potential customers see totals before the checkout page. Clear math reduces cart abandonment and protects sales revenue.
Mandatory account creation and blocked guest checkout
26% of customers abandon when forced to create an account.
Why it happens: Account creation slows the checkout flow and delays the purchasing process.
What to do: Offer guest checkout and make it visible upfront. Invite users to create an account after payment for future purchases. This approach preserves customer data capture without a complicated checkout process.
Trust, payment security, and missing methods
25% abandon due to credit card trust issues; 19% due to security concerns; 13% leave when their preferred method is unavailable.
Why it happens: Weak trust signals, unclear payment details, or limited digital wallets dissuade customers during the checkout experience.
What to do: Show SSL, badges, and recognizable processors. Offer multiple payment options, including digital wallets and local methods. Keep the payment form short and explain how you protect customer data.
A lengthy or complicated checkout process
22% of online consumers abandon the checkout process when it is long or confusing.
Why it happens: Too many fields and steps break the ideal checkout flow. Users tire of retyping credit card details and addresses.
What to do: Compress checkout flows to two or three steps. Enable autofill, address lookup, and real-time error messaging. Keep a sticky order summary visible. A cleaner checkout design reduces cart abandonment.
Shipping speed and limited delivery choices
21% of online customers abandon when shipping is slow or inflexible.
Why it happens: Long lead times or unclear dates deter customers who are ready to buy.
What to do: Offer choices across speed and price tiers. Communicate delivery dates early. If possible, offer free shipping for threshold orders and click‑and‑collect. This reduces abandoned carts and helps recover lost sales.
Returns and policies that feel risky
18% consumers abandon when the return policy feels unfriendly.
Why it happens: Risk sensitivity rises with category price and fit uncertainty.
What to do: Publish a concise return policy at key moments in the shopping journey. Use customer testimonials and user-generated content to reduce fear and make online shopping more comfortable.
Discounts and promo friction
8% consumers abandon when they cannot find or apply a promo code or discount code.
Why it happens: Shoppers expect visible fields and guidance.
What to do: Auto‑apply available codes in cart, reveal eligibility rules, and avoid trapping users in window shopping loops searching elsewhere for codes. This keeps shopping online focused and reduces abandoned shopping carts.
Measuring, diagnosing, and recovering
A disciplined measurement plan turns cart abandonment into a fixable funnel problem.
Core measures
-
Cart Abandonment Rate (CAR): Abandoned Carts/Initiated Carts×100. Use it to compare shopping carts' performance week to week.
-
Checkout Abandonment Rate: Exits at Checkout/Reached Checkout×100. Isolate checkout page issues.
-
Time on Checkout Page: Long dwell often indicates friction.
-
Form Completion Rate: Low completion means the checkout flow needs fewer steps.
-
Checkout Exit Rate: Exits from the checkout page often indicate hidden fees or payment concerns.
-
Recovery Rate: Recovered Carts/Abandoned Carts×100. Track cart recovery program effectiveness.
Diagnosis playbook
Analyze user behavior with funnel analytics and session replays. Compare the prices that customers see with competitors' prices to understand comparison-shopping patterns. If cart abandoners cluster on mobile, prioritize mobile layout and form logic. Remind customers via email, SMS, and ads to recover lost sales at the right time.
Recovery tactics
Cart recovery programs should feel helpful, not pushy. Send reminders within hours, include product thumbnails, and offer a small incentive when margin allows. Keep messaging about value, not urgency alone. Online retailers that follow this rhythm recover lost sales without training audiences to wait for coupons.
The final thoughts
Reducing cart abandonment is not about one hack. It is about removing friction where it hurts most: unclear costs, forced logins, weak payment trust, slow delivery promises, and inefficient forms. The numbers show where to start, but the craft lies in execution. It is about creating an honest price preview, making guest checkout the default, offering familiar payment methods, and keeping the checkout experience short and predictable.
When teams do this consistently, cart abandonment falls, conversion rates rise, and the business captures demand without leaning on steep discounts.