In this blog
TL/DR summary
The average bounce rate for ecommerce sites sits around the mid‑40s, with email/referral traffic and desktop devices performing best. Improve speed, relevance, mobile UX, and trust signals to move the needle without inflating ad spend.
Key points:
-
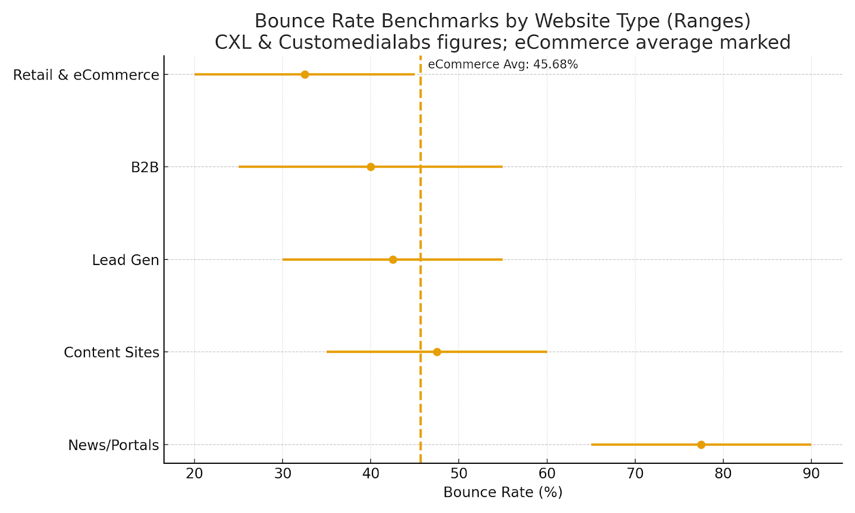
Retail band is 20–45%; CXL cites 45.68% for the current cross‑site average.
-
Mobile devices and social/display clicks drive higher bounce rates; email/referral has lower bounce rates.
-
Fix page load speed, promises vs search intent, and internal linking to guide exploration.
-
Measure with GA4’s engaged sessions plus classic bounce rate for continuity.
Treat bounce rate as a diagnostic, not a target. When the journey gets easier, every downstream metric improves.
Summary of benchmarks and signals
|
Metric / Slice |
Benchmark or Insight |
What to Do |
|
Average ecommerce bounce rate |
~45.68% (CXL) |
Treat sub‑45% as a reasonable bounce rate when paired with healthy conversion. |
|
Retail & ecommerce band |
20–45% (Customedialabs) |
Use this as your comparison set, not news or portal sites. |
|
Device pattern |
Mobile devices are at the highest, and desktops are at the lowest |
Prioritize mobile speed and clarity. |
|
Source pattern |
Email/Referral lowest; Social/Display highest |
Adjust expectations by channel and refine audiences. |
|
GA4 lens |
Engaged sessions replace legacy emphasis |
Track both for continuity and for actionability. |
|
Common technical issues |
Slow load times, server errors, broken links |
Fix before creative tests; they distort bounce rate. |
|
Content/UX issues |
Misaligned search intent, cluttered UI, hidden pricing |
Align promise to page; simplify navigation and CTAs. |
Introduction
Understanding the average bounce rate: ecommerce is not trivia, but an operational hygiene. Bounce rate is the percentage of sessions in which visitors view just one page and leave. For an ecommerce site, that is often a missed opportunity to move shoppers deeper into discovery, comparison, and checkout. Benchmarks show that the average ecommerce bounce rate sits in the mid‑40s, with channel and device mixes creating wide variation.
For businesses, that variation matters because acquisition costs keep rising and profitability hinges on keeping visitors engaged across multiple pages. Knowing your baseline, reading the patterns by source and device, and translating them into concrete fixes can improve conversion efficiency without increasing media spend.
The numbers, context, and what they mean
Based on research studies and expert analysis, we share numbers that matter regarding the average bounce rate in eCommerce.
What counts as a bounce, and why the nuance matters
A bounce rate is the share of sessions in which a user lands and leaves after viewing only one page. In GA4, an engaged session lasts 10 seconds or more, includes a conversion, or spans multiple pages; everything else contributes to bounce rates. Use Google Analytics to segment the metric by landing page, traffic source, and device so you see where visitors leave versus where visitors interact.
If you are a business owner, treat the average bounce as a directional KPI rather than a vanity number. Tie changes in your site's bounce rate to revenue per session and cart starts. When the metric improves alongside add‑to‑carts and product views, you are fixing causes, not just the symptom.
Benchmarks you can actually use.
-
Overall retail: The average ecommerce bounce rate falls within the 20–45% range. However, CXL cites 45.68% as a current cross‑site reference. That makes a good bounce rate anything consistently below the mid‑40s for comparable pages.
-
By website type (Customedialabs): News sites typically post high bounce rates (often 65–90%), content hubs around 35–60%, lead‑gen 30–55%, B2B 25–55%, and retail & ecommerce 20–45%. Retail, therefore, has one of the lowest average bounce rate bands among major categories.
-
By device: Mobile users bounce more; desktop produces the lowest bounce rates, with tablets in between. This pattern is consistent with slower page load speeds and narrower viewports on phones; mobile phone users experience more friction when visual hierarchies or forms are not optimized.
-
By source: Email and referral traffic tend to deliver good bounce rate outcomes; organic search varies by search intent; social and display have high bounce rates because click intent is casual.
If you are a business, benchmark against their closest peer group, not a generic average. If your category is “retail,” compare product pages to other product pages and landing page campaigns to other campaigns. Do not compare a help article to a carousel‑heavy hero page; informational and reference pages naturally behave differently.
Why bounce rates rise: The leading causes
Let us look at the key reasons behind the rise of the eCommerce bounce rates.
Speed, stability, and technical quality
High bounce rates correlate strongly with slow load times, layout shift, and technical errors. Server errors, broken links, and slow loading pages erode confidence before content even renders. When site speed lags, most users opt out quickly on mobile devices.
Actions:
-
Audit page load speed and template-specific load speed; prioritize hero, collection, and product pages.
-
Fix technical problems such as broken links and redirects; monitor for other third-party advertisements or external links that siphon visitors away.
-
Track exit rate alongside bounce rate data to isolate fragile templates.
Relevance and expectation‑setting
A high bounce rate often signals a mismatch between the promise and the page. Misaligned copy, search intent gaps, and generic hero modules push users bouncing back to results.
Actions:
-
Tighten headlines, search snippets, and ad copy so the landing page fulfills the query.
-
Use internal links and smart internal linking to offer clear next steps for people browsing rather than those ready to buy.
UX clarity and trust
A cluttered layout and hidden pricing create a poor user experience. If CTAs are vague, visitors leave rather than explore multiple pages.
Actions:
-
Simplify navigation, surface the “Add to Cart” option, and remove dark patterns.
-
Elevate proof (policies, reviews) without overwhelming the fold; aim for a visible, credible customer experience.
Traffic mix and campaign quality
Bad traffic from untargeted audiences inflates bounce rates. Direct traffic with low intent and broad display campaigns can lift bounce rate averages even when templates are sound.
Actions:
-
Tighten audience definitions; align creative to the landing page. Segment direct users and adjust expectations.
Visual benchmark: Where retail & eCommerce sit
Below is a compact visual of benchmark bounce rates by website type, with retail highlighted and the average ecommerce bounce rate line marked (CXL and Customedialabs figures).
Practical benchmarks and page‑level targets
Here is what you should do:
Page types across an ecommerce website
-
Homepage: Expect a typical bounce rate near the retail band. Use concise value props and internal links in bestsellers and categories.
-
Collection: Should beat your overall average bounce rates; visitors are in browse mode. Strengthen filters and sorting to increase user engagement.
-
Product pages: Poor imagery and heavy scripts create a relatively high bounce rate. Trim weight, clarify price, and place secondary paths for people not ready to buy.
-
Content pages: The average blog will skew higher. That can be fine if email capture triggers or comparison CTAs keep the relationship alive.
Businesses should optimize the templates that have the most entrances first. Fixing a high‑entrance landing page can quickly improve the overall website's performance.
Measurement notes that prevent false alarms
Here is how teams should measure and calculate bounce rates.
How teams should measure bounce rate in 2025
-
Use Google Analytics with GA4’s engaged sessions to complement the legacy bounce rate.
-
Always segment by the ecommerce sites' page type, device, and source before drawing conclusions.
-
Document your working expected bounce rate by template. Revisit monthly.
A drop in bounce rate for ecommerce pages with flat conversion can indicate curiosity without intent. Pair the metric with product views per session, cart starts, and revenue per session for a balanced read on the website's performance.
Tactical strategies to decrease bounce rate
Now that you are aware of the causes, it is vital to understand the strategies that can help address them.
Speed and rendering
-
Compress images, lazy‑load below‑the‑fold assets, and cut render‑blocking scripts on ecommerce websites.
-
Track Core Web Vitals; if a hero image shifts, user drop-off increases.
Relevance and IA
-
Map pages to search intent; merge thin ecommerce store variants.
-
Strengthen internal links across ecommerce stores so shoppers glide from category to product to cart.
Trust and assistance
-
Add shipping and returns in the fold; use live chat as personalized assistance rather than an interruption.
-
Show stock status to reduce pogo‑sticking; accuracy improves user satisfaction.
Mobile excellence
-
Tighten form fields for mobile devices; reduce taps to the cart. Remember that mobile users bounce faster when taps are imprecise.
Campaign discipline
-
Align ad promises to the landing page. Prune campaigns that create high bounce rates and poor engagement.
Conclusion: Keeping visitors in the story
When you reduce bounce rate on key templates, you are not gaming a metric; you are removing friction from a buyer’s path. Retail has one of the lowest bounce rates among site types for a reason: well‑structured journeys nudge people to explore multiple pages, compare, and commit. Use the banded benchmarks, respect the differences by device and source, and fix the root causes first—speed, relevance, and clarity.
Do that consistently and your ecommerce site will convert more of the traffic you already pay for, which is the quietest, most durable form of growth.