Add-to-Cart Conversion Rates by Industry: Benchmarks, Data & Trends (2025)
20 Nov, 2025
|
8 Min Read
Read Blog
Table of Contents
TL/DR summary
Cart abandonment is a persistent drag on ecommerce performance, but it varies by vertical. Luxury & jewelry leads with the highest cart abandonment rate, while veterinary services and pet care are the lowest. Most leakage comes from avoidable friction: late price reveals, forced accounts, and a lengthy checkout process.
Key Pointers
Global average cart abandonment rate sits near the low‑70s; mobile users abandon more than tablet/desktop users.
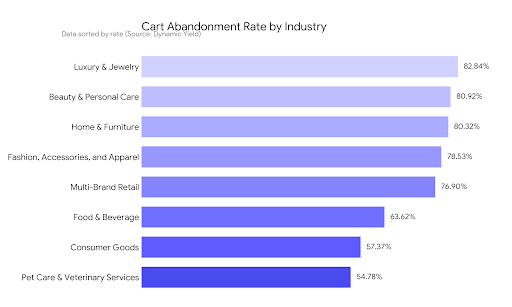
By industry: Luxury & jewelry 82.84%; Beauty & personal care 80.92%; Home & furniture 80.32%; Fashion/apparel 78.53%; Multi‑brand 76.90%; Food & beverage 63.62%; Consumer goods 57.37%; Pet care/veterinary services 54.78%.
Shipping costs and mandatory account creation are the top two triggers.
Abandoned cart emails can claw back ~10% of lost revenue.
Regions diverge: Middle East & Africa ~93% vs. North America ~76%.
Use the benchmarks to set targets, then simplify the journey: transparent pricing, guest checkout, multiple payment options, and fast delivery promises. Do that, and your brand will see fewer abandoned carts and materially higher conversion rates.
Cart abandonment has become a boardroom metric because it blends product‑market fit, pricing clarity, checkout experience, and fulfilment trust into a single signal. When shopping carts are created but not converted, the result is wasted acquisition spend and lost revenue. In 2024, brands contend with online shoppers who expect speed, transparent shipping costs, flexible payment options, and frictionless mobile UX.
Understanding the shopping cart abandonment rate by industry is therefore essential. The rate of abandoned shopping carts reveals what customers tolerate, what they reject, and where optimisation yields outsized returns. This article compiles the latest cart abandonment statistics, interprets the benchmarks by vertical, and translates the numbers into actions that lift conversion rates and defend margin.
Luxury & jewellery posts the highest cart abandonment rate among major verticals at 82%. Value sensitivity and long consideration windows are decisive factors.
Pet care and veterinary services sit at the opposite end, with the lowest rates (~55%), reflecting repeat-purchase habits for essential products.
Regions diverge: Middle East & Africa records the steepest abandonment rates (~93%), while North America is materially lower (~76%).
Additional shipping costs and mandatory account creation remain top triggers; abandoned cart emails can recover ~10% of lost sales when executed well.
The average cart abandonment rate across sectors hovers around the low‑to‑mid 70s; mobile funnels underperform desktop, particularly when the checkout process has more than 3 steps.
A consistent average shopping cart abandonment baseline matters, but actions live in the vertical nuance. Below are current benchmarks for cart abandonment rates by industry, along with what operators should infer from them.
Luxury & Jewelry: 82.84%
Beauty & Personal Care: 80.92%
Home & Furniture: 80.32%
Fashion, Accessories & Apparel: 78.53%
Multi‑brand Retail: 76.90%
Food & Beverage: 63.62%
Consumer Goods: 57.37%
Pet Care & Veterinary Services: 54.78%
| Industry |
Cart Abandonment Rate (%) |
Key Reason for Drop-Off |
Avg. Order Value (USD) |
Top Recovery Strategy |
Estimated
Revenue Loss (% of Sales)
|
| Luxury & Jewelry | 82.84 | High duties, payment trust issues | 350+ | Finance options & reassurance messaging | 15–18% |
| Beauty & Personal Care | 80.92 | Shade/fit uncertainty | 60 | Try-on tools, free samples, quizzes | 9–12% |
| Home & Furniture | 80.32 | High shipping costs, long delivery | 500+ | Transparent shipping, AR previews | 18–22% |
| Fashion & Apparel | 78.53 | Size and fit inconsistency | 80 | Instant exchanges, fit guides | 12–15% |
| Multi-Brand Retail | 76.9 | Complex basket, coupon errors | 120 | Simplified checkout, auto-apply coupons | 10–13% |
| Food & Beverage | 63.62 | Delivery slot, freshness concerns | 35 | Subscriptions, same-day delivery | 5–8% |
| Consumer Goods | 57.37 | Price comparison, low urgency | 40 | One-click reorder, bundling | 4–6% |
| Pet Care | 54.78 | Missed reorders, timing mismatch | 45 | Autoship programs, reorder reminders | 3–5% |
Luxury & Jewelry (highest cart abandonment rates): High ticket sizes, window shopping, gifting uncertainty, and ring sizing push abandonment rates up. Solve with rich media (macro photos, videos), precise taxation & duties early, digital wallets, and generous, insured shipping/returns.
Beauty & Personal Care: Shade/fit risk plus frequent online shopping on mobile drives abandoned carts. Invest in shade‑matching quizzes and personalized recommendations; bundle samples to reduce cart abandonments.
Home & Furniture: Bulky freight and long delivery ETAs create high cart abandonment rates. Display shipping fees up‑front, show in‑stock lead times at PDP, and offer room‑visualizers. Finance options reduce sticker shock during checkout.
Fashion/Apparel: Sizing variance is the top reason to abandon their carts. Offer size‑prediction widgets, clear fit notes, and free‑exchange workflows; treat exchanges as a differentiator versus returns.
Food & Beverage: Perishability compresses the decision window; on‑time slots and courier reliability lower abandonment rate.
Consumer Goods & Pet Care/Veterinary services (lowest): Repeat cadence and predictable specs reduce friction. Keep the checkout flow under three steps and enable subscriptions to cement higher conversion rates.

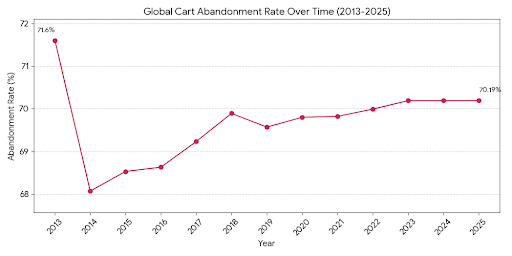
Global average cart abandonment has hovered around ~70% since 2013 and ticked up again in 2023.
Devices: mobile carts are abandoned ~75.5% of the time, compared with ~68.55% on tablets; desktops convert better at higher AOVs.
Why this matters: Plan your funnel with mobile‑first discipline, trim form fields, and surface totals early to prevent surprise extra costs.
Below, we explain the most common reasons why customers abandon carts.
Additional charges at final checkout (48%): Make taxes/duties, and shipping explicit at PDP and in the cart.
Mandatory account creation (26%): Allow guest checkout; request customer data post‑purchase.
Trust with credit card information (25%): Prominent trust badges and digital wallets.
Slow delivery (23%) & long checkout process (22%): Offer fast lanes; compress steps to three; auto‑fill addresses.
Unable to calculate total up‑front (21%): Always show landed cost.
Unsatisfactory returns policy (18%): Clarify policy near the checkout page.
The takeaway: These fixes reduce abandonment rates immediately and lift conversion rate without new traffic spend.
Channel effects: Social traffic produces the most abandoned carts (~91%) because the intent is low. Email and search show healthier intent profiles.
Regional spread: Middle East & Africa (~93%), Asia Pacific and Latin America (~87%), Nordics (~80%), North America (~76%). Calibrate your SLA and currency displays accordingly.
Age group: 25–34 is most prone to abandoning carts, followed by 35–44; tailor nudges and abandoned cart emails to these cohorts.
Economics: eCommerce stores lose roughly $18B annually due to cart abandonment; the projected merchandise value sitting in online shopping carts each year exceeds $4T.
Email recovery: Thoughtful cart abandonment emails—sent quickly with live cart contents and preferred payment methods, which will help recover ~10% of lost orders. Add price‑drop alerts and inventory warnings to re‑engage potential buyers.
Checkout craft: The average cart abandonment rate spikes beyond five steps; keep it tight. Provide multiple payment options and save carts across devices so a single online purchase that stalls on mobile can be completed on desktop.
The global cart abandonment rate began at 71.60% in 2013, then dropped to its lowest recorded level of 68.07% in 2014. Since then, the trend has been generally upward, with the rate climbing steadily through the mid-2010s. It reached 68.63% in 2016, 69.23% in 2017, and peaked slightly before the pandemic at 69.89% in 2018.
The rate hovered just under 70% for the next few years, recording 69.57% in 2019, 69.80% in 2020, and 69.82% in 2021. Most recently, the rate crossed the 70% mark again in 2023 at 70.19%, and is projected to remain stable at 70.19% through 2025.

Despite UX advances, the abandonment rate remains structurally high; improvements compound at the brand level, not the macro level.
Formula: Cart abandonment rate = (Abandoned carts ÷ shopping carts created) × 100.
Instrument your ecommerce website to tag carts at add‑to‑cart, begin‑checkout, and payment start. Track by device, region, source, and industry peer set to identify where customers abandon most.
Price clarity: display additional shipping costs and taxes on the PDP to avoid surprises.
Flow discipline: fewer form fields, guest checkout, and address auto‑complete. It leads to a better checkout flow in under three steps.
Payments: ensure sufficient payment methods, including digital wallets; align with local preferences.
Trust & speed: security badges, delivery date guarantees, and clear returns.
Lifecycle nudges: on‑site reminders, exit offers, and sequenced abandoned cart emails.
Cart abandonment is not fate; it is feedback. Treat the cart abandonment rate by industry as your competitive map, then tune the levers that matter most to your audience. Keep honest pricing (no surprise shipping), flexible payment options, low‑friction checkout, and timely fulfilment.
Brands that internalize the shopping cart abandonment statistics above, test relentlessly, and design journeys around customer expectations to move out of the average and into durable growth. It will turn abandoned intent into purchased outcomes and boost conversions without outspending rivals on acquisition.
Reference Sources